
Fig 2. The dermal thickness and collagen amount are greater in E2F1–/– mice than in WT mice.
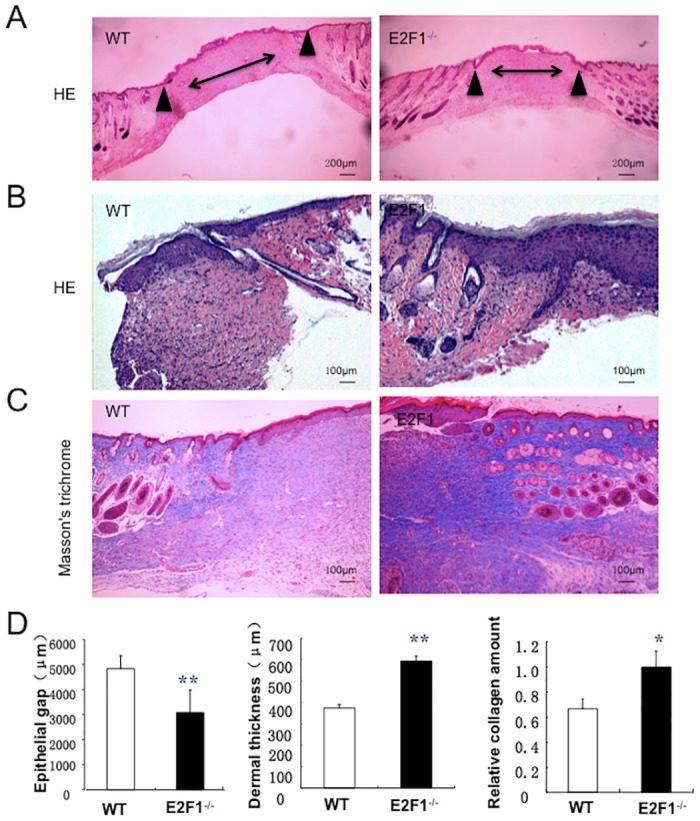
Wound tissues were isolated at day 7 post-surgery and analyzed histologically. (A-B) H.E. and (C) Masson’s trichrome staining. Both entire wound (A) and wound border zone (B-C) are shown. Arrowheads indicate edges of wound granulation tissue. Double-headed arrow bars indicate the distance between the leading edges of wounded epidermis. (D) Quantifications of Epithelial gap (left panel), dermal thickness (middle panel), and collagen deposition (right panel). **p<0.01, *p<0.05; n = 10 per group.