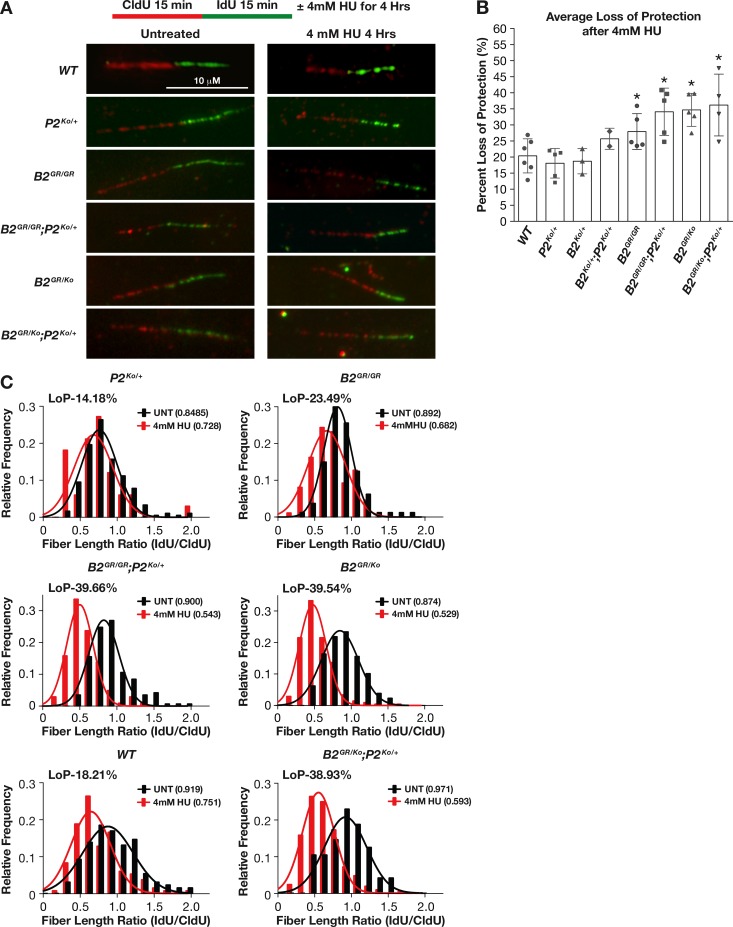
Fig 7. Brca2G25R mutation affects protection of stalled replication forks.
A. Representative images of the fork protection assay in primary MEFs of indicated genotypes in both untreated and 4mM HU treated conditions. The x-axis represents the fiber length ratio (IdU/CldU) and y-axis represents the frequency of the fibers that have the corresponding IdU/CldU ratio. B. Average loss of protection (LoP) for the various genotypes across multiple experiments. C. Representative frequency of IdU/CldU ratios in untreated (black) and HU treated (red) MEFs indicating the average ratio for untreated and HU treated (number in parenthesis) as well as percent of LoP. LoP = (1-a/b)X100, where a is the IdU/CldU ratio after HU treatment and b is the IdU/CldU ratio without HU treatment. Error bars: SD, * p<0.05. Controls are represented by: Brca2+/+, Brca2Ko/+, and Palb2Ko/+. Abbreviations: Brca2+/+ = WT, Brca2Ko/+ = B2Ko/+, Brca2G25R/G25R = B2GR/GR, Brca2G25R/Ko = B2GR/Ko, Palb2Ko/+ = P2Ko/+.

