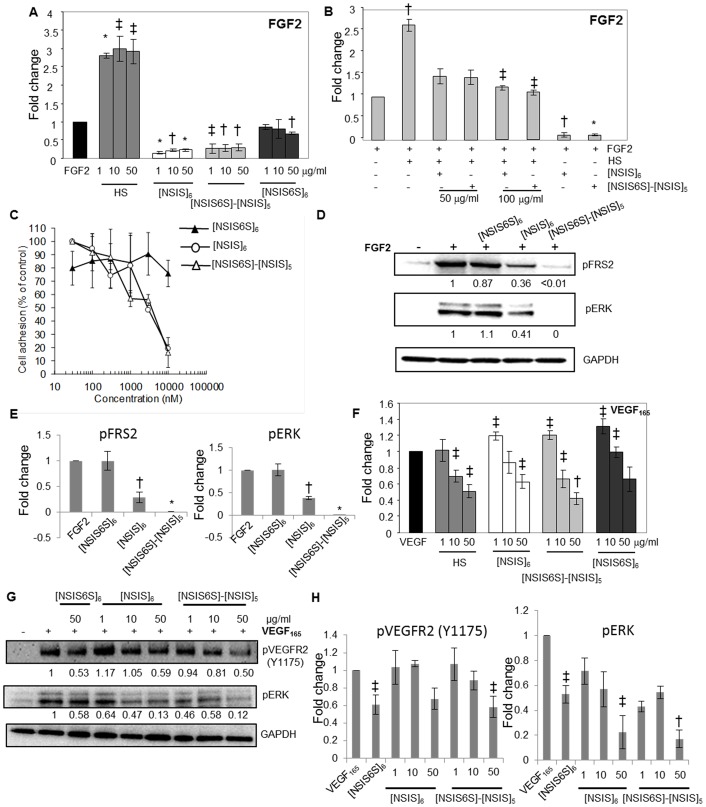
Fig 3. Impact of dodecasaccharides on FGF2/FGFR1 and VEGF/VEGFR2 complex formation.
A, levels of FGF2 bound to FGFR1 IIIc-Fc–coated plates were measured by ELISA. Binding of FGF2 to FGFR1 is expressed as 1 (control). Fold change in FGF2 binding to FGFR1-coated plates in the presence of HS or specific dodecasaccharides at increasing concentrations as compared to control is shown. Each experiment was performed twice in triplicate. The data are presented as the mean ± SD (n = 2). *, P < 0.001; †, P < 0.01; ‡, P < 0.05. B, the ability of [NSIS]6 and [NSIS6S]-[NSIS]5 to compete with HS (1 μg/ml) for binding of FGF2 to FGFR1. FGF2 was premixed with HS alone (1 μg/ml), HS and [NSIS]6 or [NSIS6S]-[NSIS]5 (50 and 100 μg/ml) or dodecasaccharides alone (50 μg/ml). FGFR1-bound FGF2 was detected by ELISA. FGF2 binding to FGFR1 in the absence of HS and dodecasaccharides is expressed as 1 (control). The data were derived from two independent experiments performed in triplicate and shown as the mean ± SD. *, P < 0.001; †, P < 0.01; ‡, P < 0.05. C, A745 CHO flg-1A cells were added to the wild type CHO-K1 monolayers in serum-free medium containing FGF2 in the absence or presence of indicated dodecasaccharides. Cells adherent to the monolayer were counted following incubation for 2 hours. The data are presented as a percentage of cell binding in the absence of dodecasaccharides (100%). Each point is the mean ± SD of three independent experiments performed in triplicate. D, serum-starved HUVEC were stimulated with FGF2 (20 ng/ml) for 10 min in the absence or presence of indicated dodecasaccharides. Phosphorylated FRS2 and ERK were detected by Western blotting. Total protein loading levels were visualized by probing with the anti-GAPDH antibody. Stimulation with FGF2 alone is expressed as 1. Normalized fold change in the intensities of bands as compared to FGF2 stimulation alone is shown below each blot as determined by densitometric analysis. E, densitometric evaluation of the intensities of bands combined from an independent experiment performed as in D and an experiment shown in D. Fold change in phosphorylated FRS2 and ERK levels in response to FGF2 stimulation in the absence and presence of oligosaccharides is shown. Values represent the mean ± SD (n = 2). *, P <0.0001 †, P < 0.01. F, levels of VEGF165 bound to VEGFR2-Fc were measured using VEGF-specific ELISA. VEGF165 binding to VEGFR2-coated plate in the absence of HS or dodecasaccharides is expressed as 1. Two independent experiments were performed in triplicate and the data are presented as the mean ± SD. †, P < 0.01; ‡, P < 0.0001. G, inhibition of VEGF165-induced phosphorylation of VEGFR2 and ERK. Serum-starved HUVEC were stimulated with VEGF165 (20 ng/ml) for 5 min in the absence or presence of dodecasaccharides at indicated concentrations. Phospho-VEGFR2 (Y1214 and Y1175) and phospho-ERK were detected by immunoblotting with the respective antibodies. GAPDH levels show equal total protein levels. The intensities of bands for phospho-VEGFR2, phospho-ERK and GAPDH were analysed by densitometry. Phospho-VEGFR2 and phospho-ERK levels were normalized to GAPDH levels. Stimulation with VEGF165 alone is expressed as 1. Fold change in the intensities of phosphorylated VEGFR2 and ERK upon each treatment is shown below the blots. H, average values of band intensities generated by densitometric analysis of bands shown in G and those from another independent experiment are shown. Numbers on the horizontal axis show different concentrations of each oligosaccharide. The mean ± SD (n = 2) is shown. †, P <0.01 ‡, P < 0.05.

