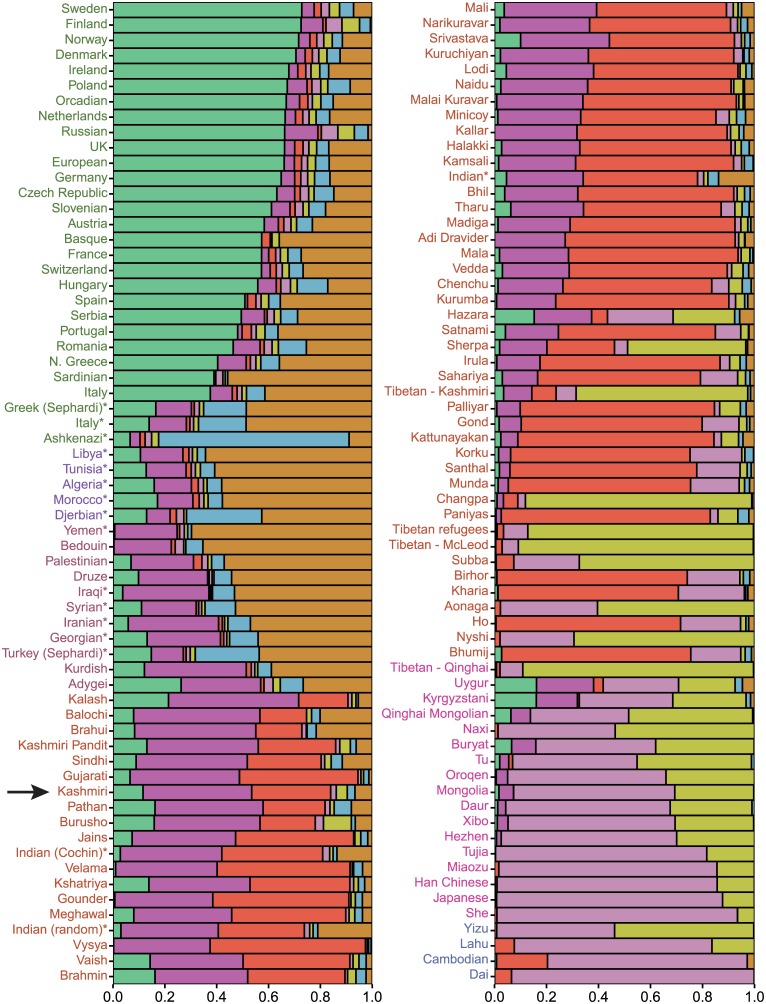
Fig 2. An ADMIXTURE plot showing the proportion of ancestry each hypothetical ancestral population (K = 7) contributes to each studied population.
The mean admixture proportion of each component across each given population was calculated and the sum rescaled to one. The black arrow indicates the admixture proportions of the Kashmiri population. * indicates Jewish populations. The admixture profile of the Kashmiri population is similar to other northern Indian and Pakistani populations.

