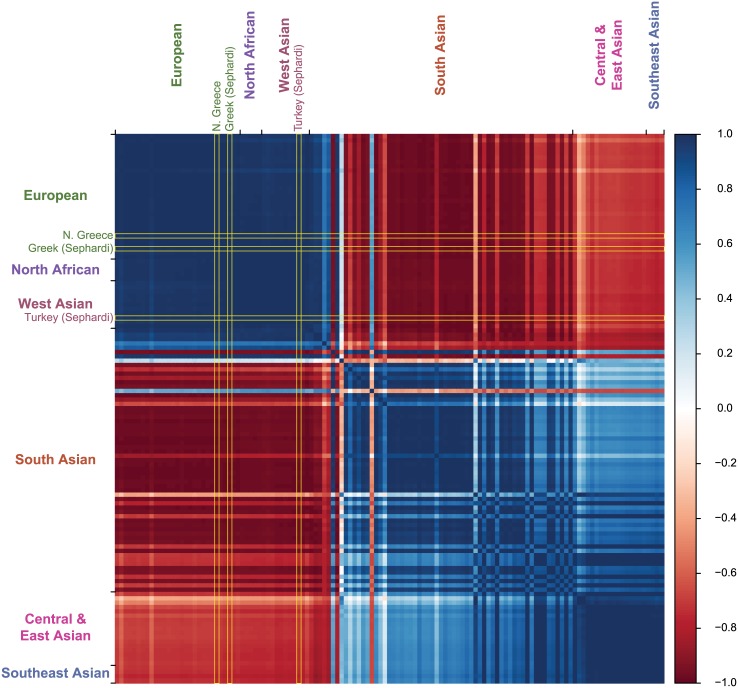
Fig 3. A heatmap displaying the amount that the f3 results of a particular population are correlated with another population.
The intersection of a row and column represents how correlated the f3 results are of those two populations. The columns and rows are in the same order as displayed in Fig 2. Darker shades of blue indicate that the two populations in question have strongly correlated f3 results whereas darker shades of red indicate anti-correlation. The geographical groupings of the subpopulations are indicated in the margins of the Fig The correlation comparisons of the northern Greek, Sephardic Greek, and Sephardic Turkish populations are highlighted in yellow. The f3 results of west Eurasian populations are highly correlated with each other. South Asian populations also tend to be correlated with other populations of South Asian ancestry.

