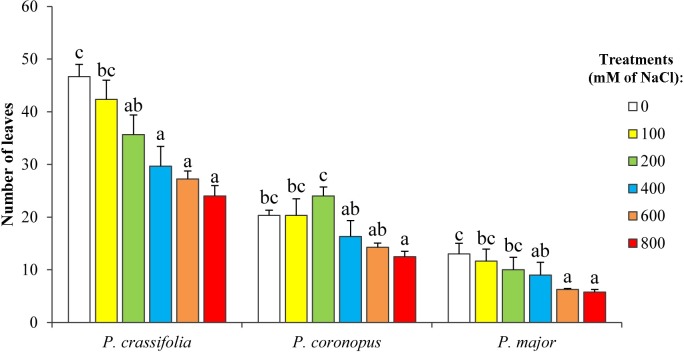
Fig 1. Salt-induced inhibition of plant growth.
Number of leaves of Plantago plants after four weeks of treatement with the indicated NaCl concentrations (means ± SD, n = 5). Different lower case letters within each species indicate significant differences among treatments according to Tukey test (α = 0.05).

