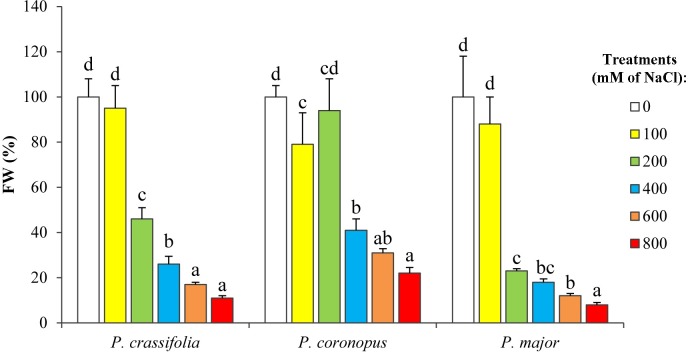
Fig 2. Inhibition of plant growth in the presence of increasing salt concentrations.
Leaf fresh weight after four weeks of treatment with the indicated NaCl concentrations, for the three tested Plantago species. For each species, values (means ± SD, n = 5) are shown as percentages of the mean FW of the control plants, considered as 100% (absolute values: 11.35 ± 1.84 g, 10.61 ± 0.86 g, and 25.83 ± 3.51 g for P. crassifolia, P. coronopus and P. major, respectively). Different lower case letters within each species indicate significant differences among treatments according to Tukey test (α = 0.05).

