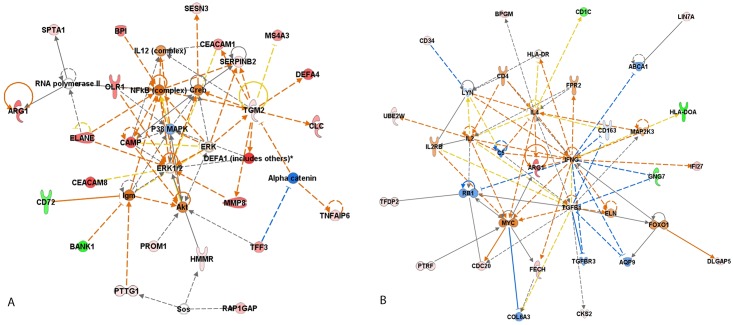
Fig 3. Top interaction networks for the 67 DEG in PBC of patients with abnormal decline of LVEF after DOX-chemotherapy identified by Ingenuity pathway analysis.
(A) Network 1 “Connective tissue disorder, Immunological disease, Inflammatory disease”; (B) Network 2 “Cellular movement, Hematological system development and function, Immune cell trafficking”. Red filled (up-regulation) and Green filled (down-regulation); Blue line (leads to inhibition); Orange line (leads to activation); Black line (effect not predicted).

