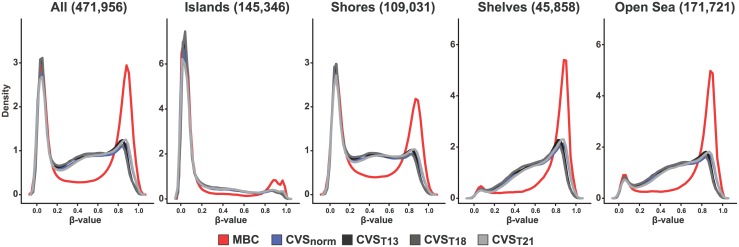
Fig 1. Density plot.
Methylation level distribution for all sites and for CpG-islands, CpG shores (2 kb flanking CpG islands), CpG-shelves (2kb flanking CpG shores) and open sea (CpGs not mapping to islands, shores or shelves). X axis represents methylation level as mean β-values. Y axis represents relative density. Maternal blood cells (MBC) red line, CVS normal blue line, CVS T13 black line, CVS T18 dark grey line, T21 light grey line.

