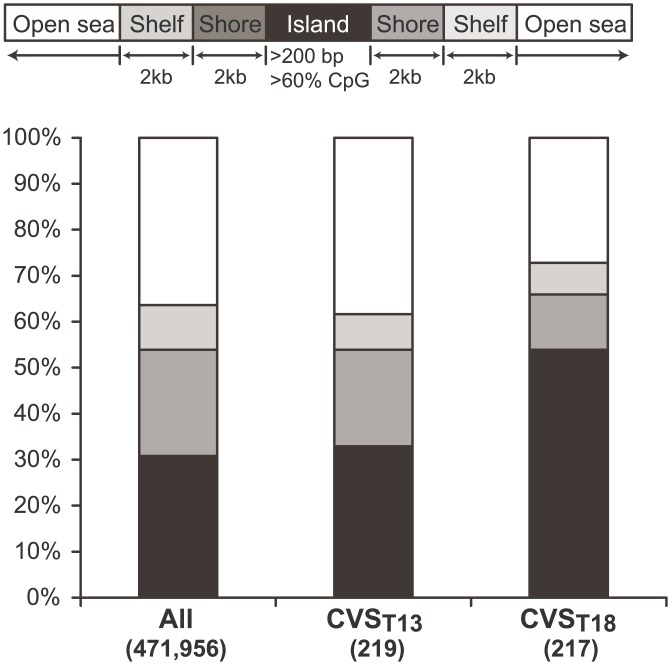
Fig 2. Stacked bar plot representation of the distribution of CpG sites.
First column shows the distribution of all the 471,956 investigated CpG sites on the microarray split into CpG Islands (black), Shores (dark grey) Shelves (light grey) and open sea (White). Second and third columns show the distribution of sites that were significantly higher methylated in T13 and T18 compared to normal CVS samples.

