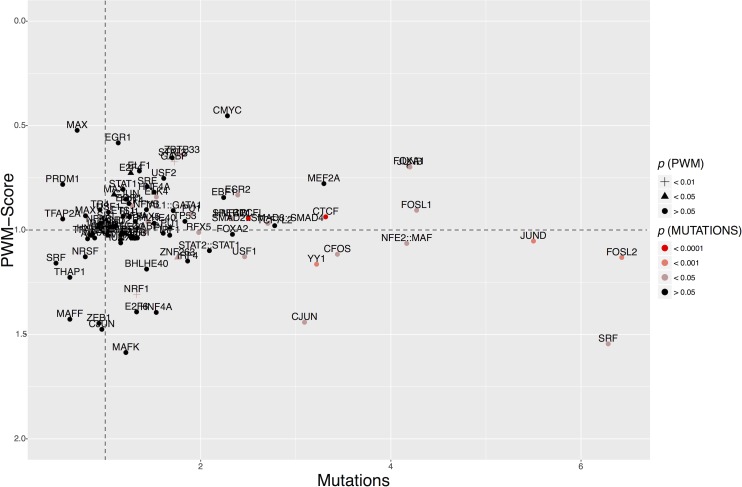
Fig 2. Mutation accumulation and TFBS motif disruption in cancer compared to control sites and polymorphism data.
The X-axis shows the ratio of the number of substitutions in functional, relative to control sites in cancer, divided by the corresponding numbers for 1KG polymorphisms, i.e. (cancer_functional/cancer_control)/ (1KG_functional/1KG_control). Values > 1 indicate an excess of mutations in functional binding sites in cancer, correcting for the amount of variability that is tolerated at these sites at the population level. The Y-axis shows the corresponding ratio for the reduction in PWM-score. Values < 1 indicate that the matrix score is reduced to a greater extent in functional, relative to control sites in cancer compared to 1KG polymorphisms. The color and shape of the data points indicate the significance of their departure from random expectation. Note that some motifs were excluded from this plot because the p-value for the difference in PWM-score reduction could not be calculated (full list in S1 Dataset).

