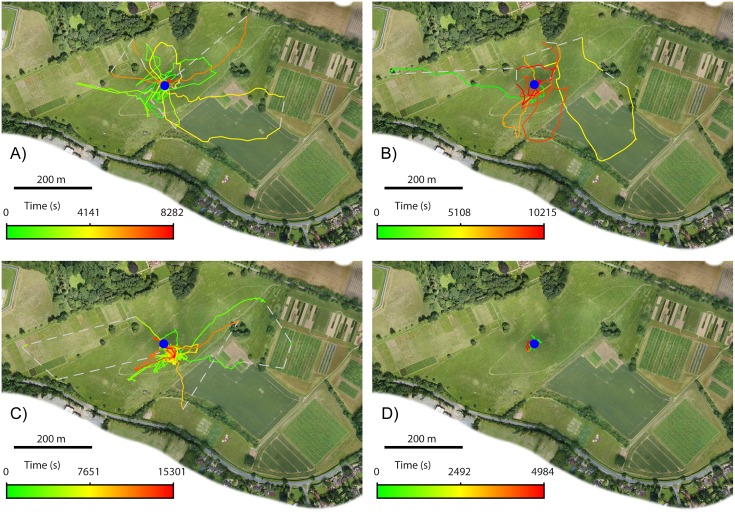
Fig 2. Flight paths of initial exploratory flights of four bees.
The position of the nest is marked by a blue circle. Colours represent the time from the start of each flight: initial portion of each flight is in green, changing smoothly through yellow until the end of the flight is shown in red. Grey dashed lines are used to join radar observations made more than 30 s apart, when the bee’s location was uncertain. A-D): flights of Bee 1–4 respectively.

