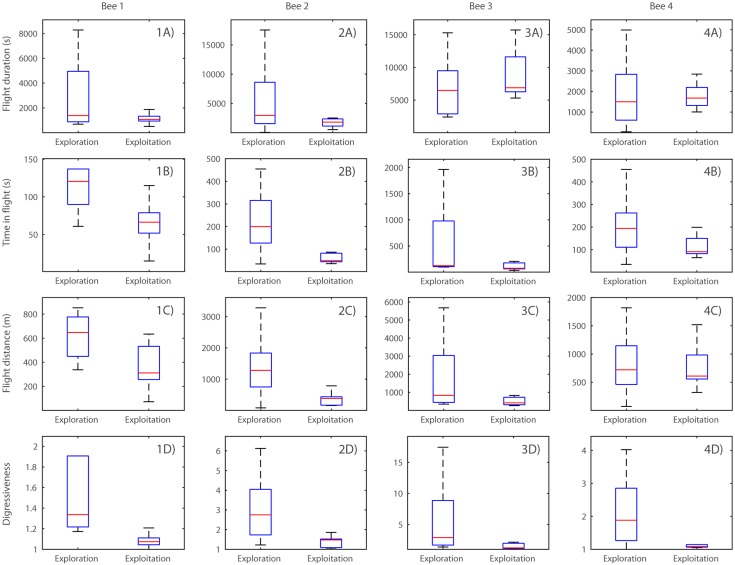
Fig 3. Comparison of flight characteristics of exploitation and exploration flights.
Boxes show median and interquartile range, and whiskers represent the range of the data. Outliers have been removed for clarity (outliers defined as data-points lying more than 1.5 times the interquartile range outside the quartiles). 1-4A) flight duration of exploration and exploitation flights for Bee 1–4 respectively; 1-4B) time in flight; 1-4C) flight distance; 1-4D) digressiveness scores. Note that the ordinates differ in scale due to high levels of inter-individual variation.

