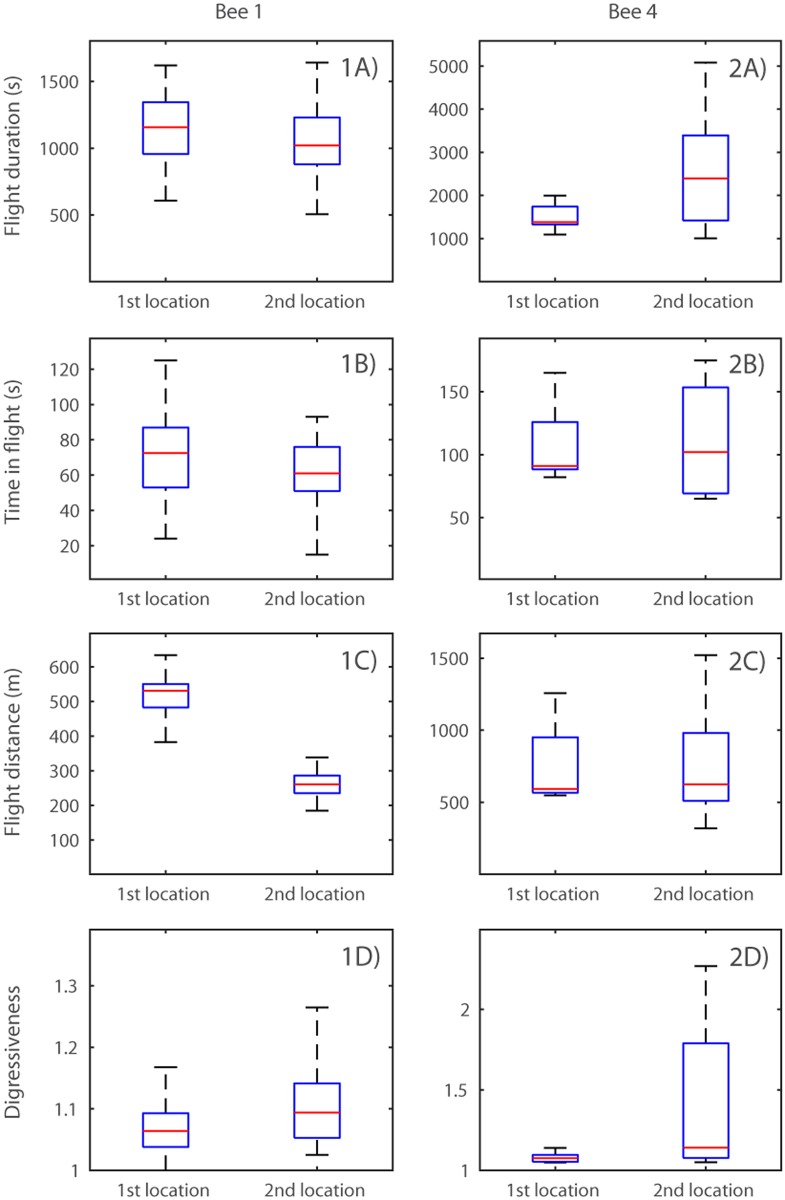
Fig 4. Comparison of characteristics of exploitation flights made to the first or second destination exploited by Bees 1 and 4.
Boxes show median and interquartile range, and whiskers represent the range of the data. Outliers have been removed for clarity (outliers defined as data points lying more than 1.5 times the interquartile range outside the quartiles). 1-2A) Flight duration of exploration visits to the 1st and 2nd location exploited by Bees 1 and 4, respectively; 1-2B) time in flight; 1-2C) flight distance; 1-2D) digressiveness score. Note that the ordinates differ in scale due to high levels of inter-individual variation.

