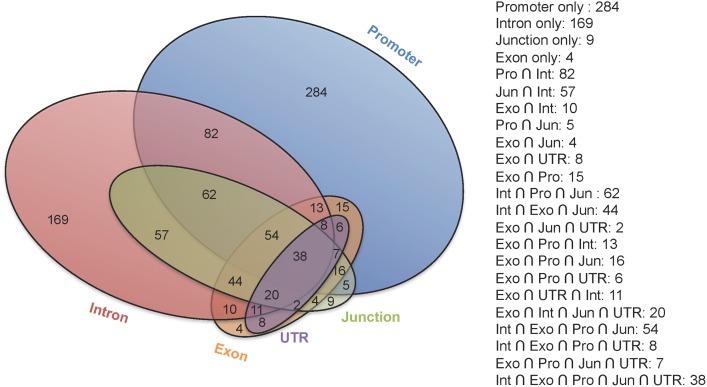
Fig 4. The number of genes that contain SS in different gene regions.
The Venn diagram shows the number of genes that contains SS with ‘θ’ > 0.61219, corresponding to a GWp< .00001 in single or multiple gene regions. Each color circle represents one gene region, i.e. Blue: promoter, Red: intron, Green: junction, Orange: Exon, Purple: UTR. The number in each “section” within circle(s) is number of genes, e.g. 284 genes that contain SS only in the promoter, while there are 82 genes that have SS in the intron and promoter regions but not in other regions. The diagram illustrates that a large number of genes contains SS in single region of the gene. However a number of genes contain SS in multiple regions as shown in the column of overlaps on the right.

