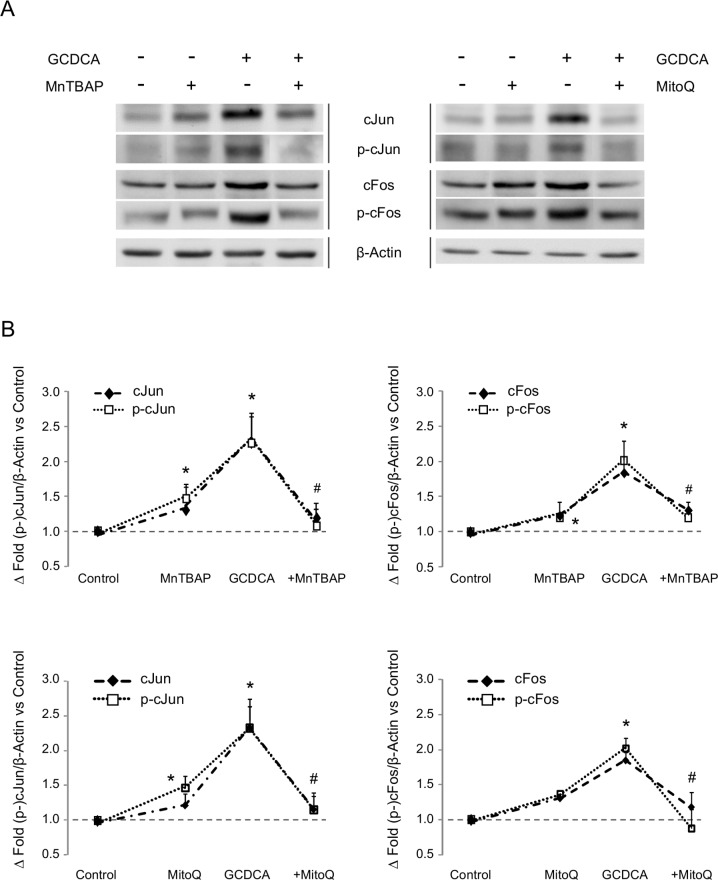
Fig 1. Expression of transcription factors cJun and cFos in GCDCA-treated HepG2.
Effect of the administration of MnTBAP or MitoQ. (A) Representative western blots for cJun (n = 3), phospho-cJun (Ser63) (n = 4), cFos (n = 5) and phospho-cFos (Ser374) (n = 4). Β-Actin was used as loading control. (B) Densitometry analysis of blots included in panel A. In the densitometry analysis, the + sign indicates GCDCA administration plus the showed treatment. Data as mean ± SE versus control group. Statistically significant difference versus control group* or versus GCDCA group# are marked.

