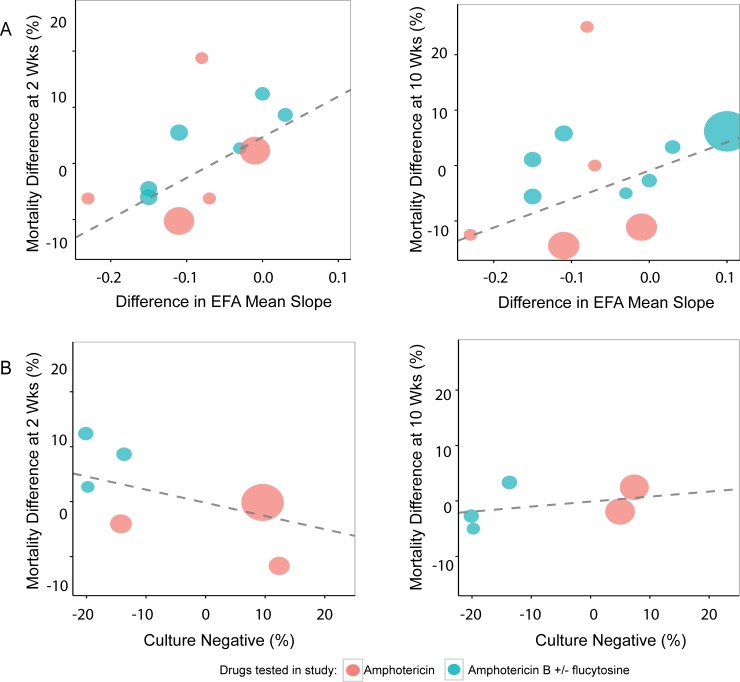
Fig 4. Trial–level correlations of treatment effect on EFA compared to treatment effects on ACM: All studies with non-missing data are displayed.
N = 9 studies and 26 arms A) Average EFA slope vs ACM at 2 and 10 weeks (6 studies and 18 arms). B) % CSF culture negative vs ACM at 2 and 10 weeks (4 studies and 12 arms).

