. 2016 Jul 19;5:e17029. doi: 10.7554/eLife.17029

Figure 4. Positions and interactions of the N-terminal domains of RelA.

(A) Pseudo-hydrolase (PH; pink) and synthetase (Synth; red) domains are in the intersubunit space between the sarcin-ricin loop (SRL) of the 23S rRNA and the spur of the 16S rRNA. The N-terminal domains are shown in a conformation, in which the synthetase domain is near the spur (Structure IV is shown). (B) Comparison of the two conformations of the N-terminal domains inferred from the heterogeneous cryo-EM density by additional sub-classification (Structure IV is shown; see also Figure 4—figure supplement 1). The red model is shown as in (A). The gray model exhibits a conformation shifted away from the spur. (C) Relative positions of the synthetase domain and the spur in Structure IVa. (D) Structure of the innate immune sensor OAS1 (blue, PDB: 4RWP) bound with an RNA helix (magenta) (Lohöfener et al., 2015). OAS1 is a second-messenger-(2′-5′-oligoadenylate)-synthesizing enzyme, whose architecture resembles that of the synthetase domain of RelA, shown in a similar orientation in (C). The nucleotide-binding loop (NB loop) and other structural elements are labeled.

DOI: http://dx.doi.org/10.7554/eLife.17029.013

Figure 4.

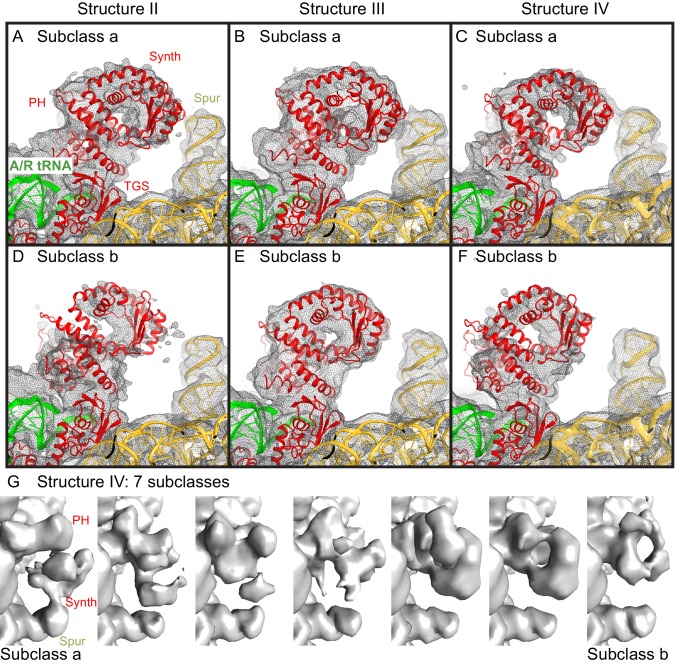
Figure 4—figure supplement 1. Cryo-EM densities for the N-terminal domains, obtained by sub-classification of Structures II, III and IV.

Figure 4—figure supplement 1.

(AF).Two predominant conformations of the N-terminal domains are shown, obtained by sub-classification of each Structure into three classes. In one class, the synthetase domain is in the vicinity of the 30S spur (Subclass a, panels AC), whereas in the second class, the synthetase domain is shifted by ~10 Å away from the spur (Subclass b, panels DF). The spur, A/R tRNA, and domains of RelA (pseudo-hydrolase (PH), synthetase (Synth) and TGS) are labeled. Colors are as in Figure 1. The maps, which were softened by applying a B-factor of 20 Å2 and 6 Å low-pass filter, are shown at 1.25–1.5 σ. (G). Sub-classification into 7 subclasses shows additional positions of the synthetase domain between the extreme positions (the latter are similar to Subclasses a and b, shown in panels AF). The maps for Structure IV, which were softened by applying a B-factor of 20 Å2 and 10 Å low-pass filter, are shown at 1.4 σ.
Figure 4—figure supplement 2. Comparison of the synthetase domain of RelA with metazoan innate immune sensors OAS1 and cGAS.

Figure 4—figure supplement 2.

(A) Position of the synthetase domain of RelA (red) in Structure IV near the tip of the spur of the 30S subunit (yellow). (B) Interaction of OAS1 (blue) with an RNA helix (magenta) results in conformational rearrangements relative to the apo-form of OAS1 (gray; PDB: 4WRP and 4WRQ; [Lohöfener et al., 2015]). (C) Interaction of cGAS (blue) with a DNA helix (magenta) results in conformational rearrangements relative to the apo-form of cGAS (gray; PDB: 4K96 and 4K8V;[Gao et al., 2013]).