. 2016 Jul 19;5:e17029. doi: 10.7554/eLife.17029

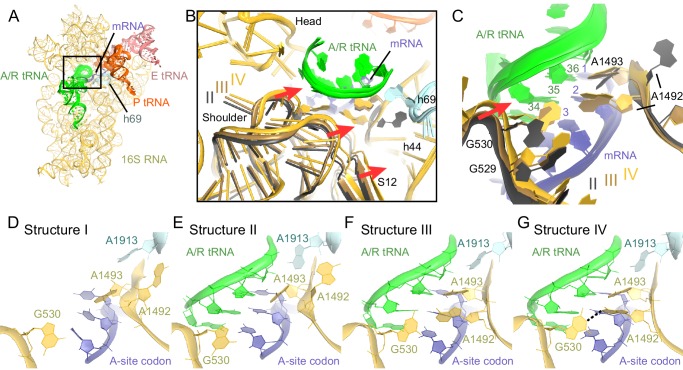
Figure 6. Closure of the 30S subunit and decoding-center rearrangements in Structures II, III and IV.

(A) A view down on the 30S subunit from the inter-subunit interface shows the position of the decoding center (boxed). The 50S subunit (except for helix 69), small ribosomal proteins and RelA are omitted for clarity. (B) The conformational differences in the 30S subunits of Structures II, III and IV suggest a domain-closure pathway. From Structure II to IV, the 30S shoulder is shifted by more than 4 Å toward the 30S head. The superposition of Structures II, III, and IV was performed by structural alignment of nt 980–1200 of 16S rRNA, corresponding to the 30S head. (C) Conformational differences in the decoding-center’s universally conserved nucleotides A1492, A1493, and G530 of Structure II, III, and IV are shown after alignment as in (B). (D) The decoding center of Structure I, which lacks A/R tRNA, is similar to that of the 30S domain-open structures with a vacant A site (Ogle et al., 2001; Jenner et al., 2010). (E) The decoding center of Structure II reveals a previously unseen state, in which the domain-open 30S subunit contains a tRNA in the A site. A1493 is near the first base pair of the codon-anticodon helix; A1492 is in helix 44, whereas G530 adopts the conformation previously observed in the absence of the A-site tRNA (Ogle et al., 2001; Jenner et al., 2010). (F) The decoding center of Structure III reveals a previously unseen state, in which the 30S subunit adopts an intermediate domain-closure conformation. A1493 and A1492 interact with the first and second base pairs of the codon-anticodon helix, respectively, whereas G530 is oriented toward A1492. (G) The decoding center of Structure IV, with a closed 30S conformation, comprises A1493 and A1492 forming A-minor interactions with the first two base pairs of the codon-anticodon helix, whereas G530 is shifted toward helix 44 and interacts with A1492. This conformation resembles that of other 30S domain-closed structures in pre-accommodation-like 70S•EF-Tu•aa-tRNA complexes (Stark et al., 2001; Valle, 2002; Schmeing et al., 2009) and 70S complexes with fully accommodated A/A tRNA (Voorhees et al., 2009; Jenner et al., 2010; Demeshkina et al., 2012). Proteins are omitted for clarity in (CG).

DOI: http://dx.doi.org/10.7554/eLife.17029.019

Figure 6—source data 1. Distances between Structures II, III and IV, reflecting the movement of the 30S shoulder domain from Structures II to III to IV, relative to the head and the body of the 30S subunit.
DOI: 10.7554/eLife.17029.020

Figure 6.

Figure 6—figure supplement 1. Comparison of the 30S subunits of Structures II, III and IV reveals domain closure of the 30S subunit from Structure II to IV.

Figure 6—figure supplement 1.

The 30S subunit adopts the most open conformation in Structure II, intermediate conformation in Structure III, and most closed conformation in Structure IV. In Structure IV, the shoulder of the 30S subunit at helix 16 (h16) and helix 18 (h18) with the 530 loop is shifted by more than 4 Å toward the head, relative to those in Structure II (see also Figure 6—source data 1). The superposition was obtained by structural alignment of the 23S rRNA from Structures II, III and IV. Sarcin-ricin loop (SRL) is shown as part of the 23S rRNA for reference. Structure II is colored gray, Structure III is colored gold, and Structure IV is colored as in Figure 1.
Figure 6—figure supplement 2. The nucleotides at the decoding center and vicinity are resolved in the cryo-EM density.

Figure 6—figure supplement 2.

(A) Example of cryo-EM density near the decoding center in Structure III. The map was sharpened by applying a B-factor of -100 Å2 and is shown at 3.2 σ. (B) Example of cryo-EM density showing the codon:anticodon interaction (blue and green) in Structure IV. The map was sharpened by applying a B-factor of -200 Å2 and is shown at 6.0 σ.
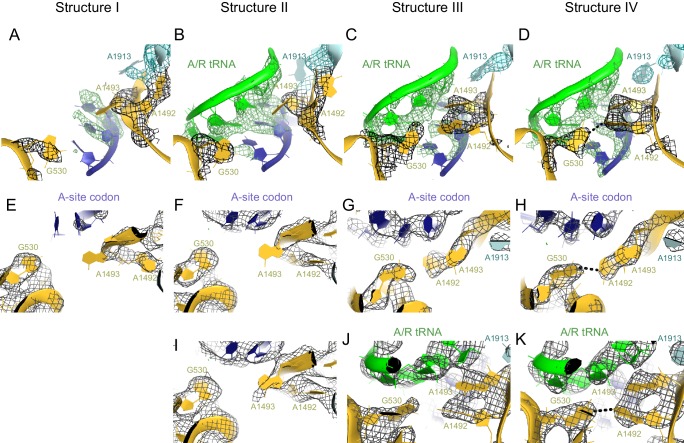
Figure 6—figure supplement 3. Conformational differences between the decoding centers of Structures I through IV.

Figure 6—figure supplement 3.

(A) Cryo-EM density (shown as mesh) of the decoding center in Structure I. The map was sharpened by applying a B-factor of -120 Å2 and density is shown at 2.0 σ for mRNA, 4.0 σ for G530, 2.0 σ for A1492, A1493 and A1913. (B) Cryo-EM density for the decoding center in Structure II. The map was sharpened by applying a B-factor of -100 Å2 and density is shown at 2.6 σ for mRNA and anticodon of tRNA, 3.5 σ for G530, and 2.3 σ for A1492, A1493 and A1913. (C) Cryo-EM density for the decoding center in Structure III. The map was sharpened by applying a B-factor of -120 Å2 and density is shown at 3.3 σ for mRNA and anticodon of tRNA, 3.3 σ for G530, 3.0 σ for A1492, A1493, and A1913. (D) Cryo-EM density for the decoding center in Structure IV. The map was sharpened by applying a B-factor of -120 Å2 and density is shown at 4.0 σ for mRNA and anticodon of tRNA, 4.0 σ for G530, 3.5 σ for A1492 and A1493, and 3.5 σ for A1913. (EH) Additional views of cryo-EM densities for G530, A1492 and A1493 in Structures I-IV. The direction of the view is approximately down the helical axis of the anticodon-stem loop of the A/R tRNA (not shown). (E). Cryo-EM density for G530, A1492 and A1493 in Structure I. The map was sharpened by applying a B-factor of -120 Å2; density is shown at 2.3 σ. (F) Cryo-EM density for G530, A1492 and A1493 in Structure II. The map was sharpened by applying a B-factor of -100 Å2 and density is shown at 2.1 σ. (G) Cryo-EM density for G530, A1492 and A1493 in Structure III. The map was sharpened by applying a B-factor of -120 Å2 and density is shown at 2.5 σ. (H) Cryo-EM density for G530, A1492 and A1493 in Structure IV. The map was sharpened by applying a B-factor of -120 Å2 and density is shown at 3.5 σ. (I) Cryo-EM density for the decoding center nucleotides of Structure II, shown at 1.6 σ. Weak density for A1493 is visible. The map was sharpened by applying a B-factor of -100 Å2. (J) Cryo-EM density for the decoding center of Structure III, shown at 3 σ. The map was sharpened by applying a B-factor of -120 Å2. (K) Cryo-EM density for the decoding center of Structure IV, shown at 3.5 σ. The map was sharpened by applying a B-factor of -120 Å2. The structures are colored as in Figure 1.