
Figure 11. PGE2 is released during hypercapnia.
The aCSF contents exhibited an increase in microenvironmental PGE2 levels during hypercapnia in 12 out of 12 slices. Here, the PGE2 concentration of a brainstem slice culture is displayed during control and hypercapnic periods (a). When gap junctions were inhibited (18-α-GA, blue line), the PGE2 levels remained unaltered during hypercapnia (N=4). The average PGE2 level throughout the whole experiment was not affected by hypercapnia, but the peak value was higher during hypercapnia than under control conditions (b). N: number of slices. Data are presented as means ± SD. *p<0.05. Source data are available in a separate source data file.
DOI: http://dx.doi.org/10.7554/eLife.14170.052
Figure 11—source data 1. Hypercapnia PGE2 ELISA data.
elife-14170-fig11-data1.xlsx (40.5KB, xlsx)
DOI: 10.7554/eLife.14170.053

Figure 11—figure supplement 1. mPGEs-1 is expressed in astrocytes in the proximity of the ventral border of the pFRG.
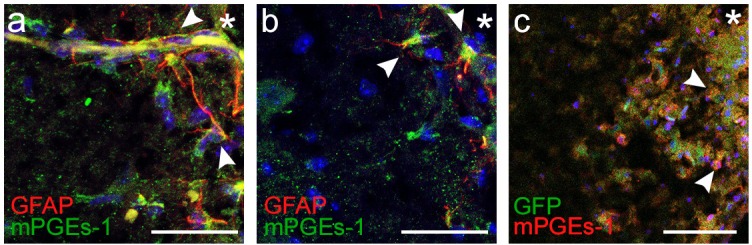
Expression of mPGEs-1, critical for PGE2 production, was found in GFAP-expressing astrocytes (arrowheads) proximal to the ventral medullary border in acute frozen brainstem tissue. This was evident in both wild-type mice and transgenic mice with GFAP-driven expression of GFP (N=11/11 and 6/6 respectively). N: number of slices. Scale bars: 100 µm. * indicates the ventrolateral edge of the brainstem.