. 2016 Jul 5;5:e14170. doi: 10.7554/eLife.14170

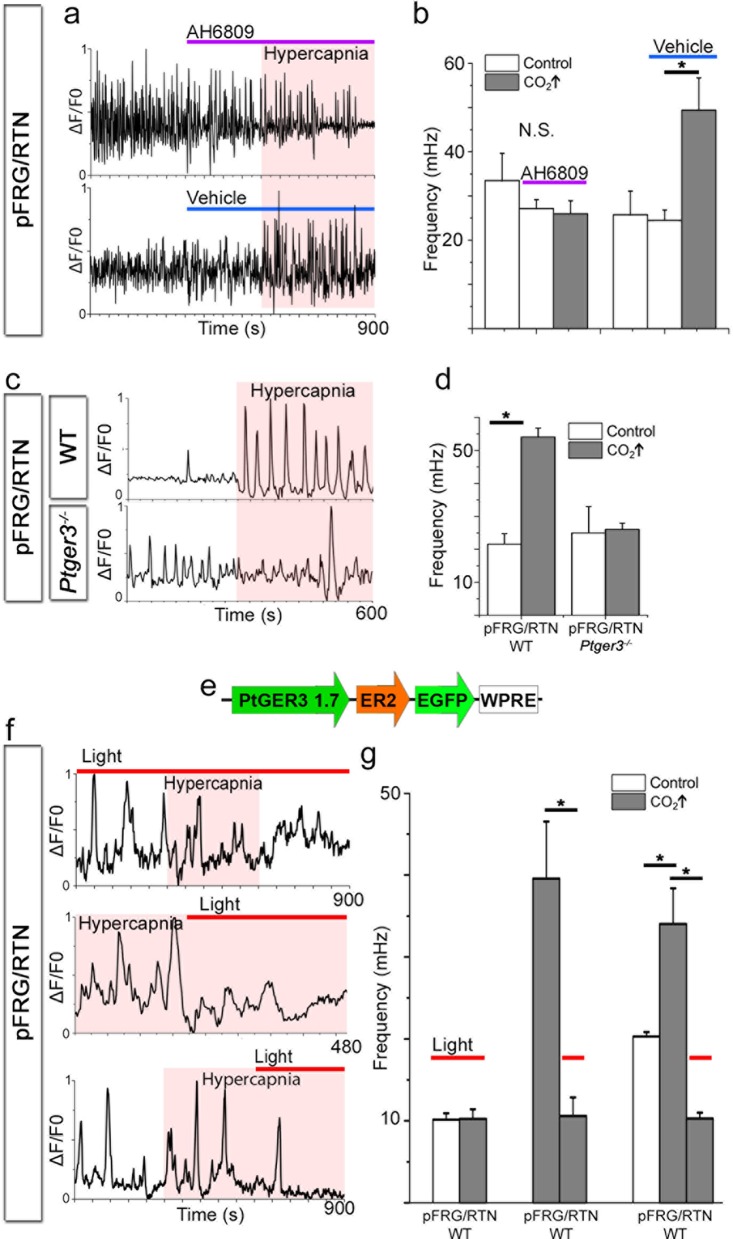
Figure 13. PGE2, acting through EP3R, is crucial for the hypercapnic response.

Pharmacological inhibition of EP3R by the EP receptor antagonist AH6809 inhibited the response to hypercapnia (increased pCO2[CO2↑]) in the pFRG/RTN (N=6, n=472, N.S.; ab). The hypercapnic response was also absent in pFRG/RTN slices lacking EP3R (Ptger3−/−; N=5, n=348, N.S.; cd). Layout of the lentivirus containing Halo57 (ER2) and eGFP genes under the control of the EP3R promoter (Ptger3) used for optogenetics (WPRE=gene enhancing element; e). During optogenetic silencing of Ptger3-expressing cells, no frequency changes were observed in response to hypercapnia (f, top trace; g, left graph). The hypercapnic response was also reversed by activating Ptger3-Halo57 (f, middle and bottom trace; g, middle and right graph). Red line: Halo57 activation in response to 625 nm light. N: slices, n: cells. Data are presented as means ± SD. *p<0.05. Source data are available in a separate source data file.

DOI: http://dx.doi.org/10.7554/eLife.14170.058

Figure 13—source data 1. EP antagonist data.
DOI: 10.7554/eLife.14170.059
Figure 13—source data 2. Hypercapnia EP3R data.
DOI: 10.7554/eLife.14170.060
Figure 13—source data 3. Optogenetics data.
DOI: 10.7554/eLife.14170.061

Figure 13.

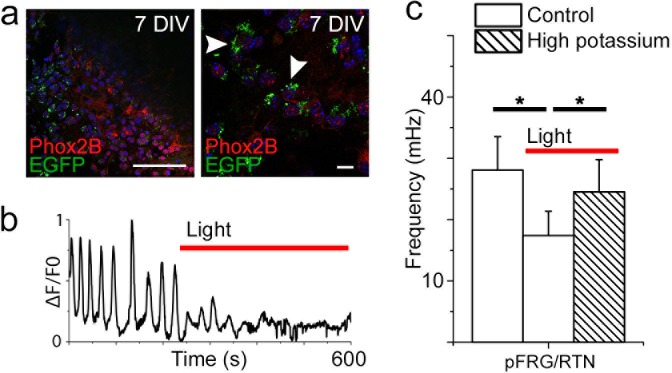
Figure 13—figure supplement 1. Optogenetic silencing of Ptger3-expressing cells decreases respiration-related activity.

Figure 13—figure supplement 1.

Transduced slices show the expression of EGFP in the pFRG/RTN, localized through Phox2b staining (a, left). Phox2b-positive cells express EGFP after transduction (a, right, arrowheads). Silencing Ptger3 cells with Halo57 stimulation decreased the frequency of the entire pFRG/RTN (b). General depolarization caused by an increase in the potassium concentration to 9 mM increased the average network frequency in both the preBötC and pFRG/RTN during optogenetic inhibition (N=6; c). Red line: Halo57 activation in response to 625 nm light. N: number of slices. DIV: days in vitro. Scale bars: 100 µm (a, left), 10 µm (a, right). Data are presented as means ± SD. *p<0.05. Source data are available in a separate source data file.