. 2016 Jul 5;5:e14170. doi: 10.7554/eLife.14170

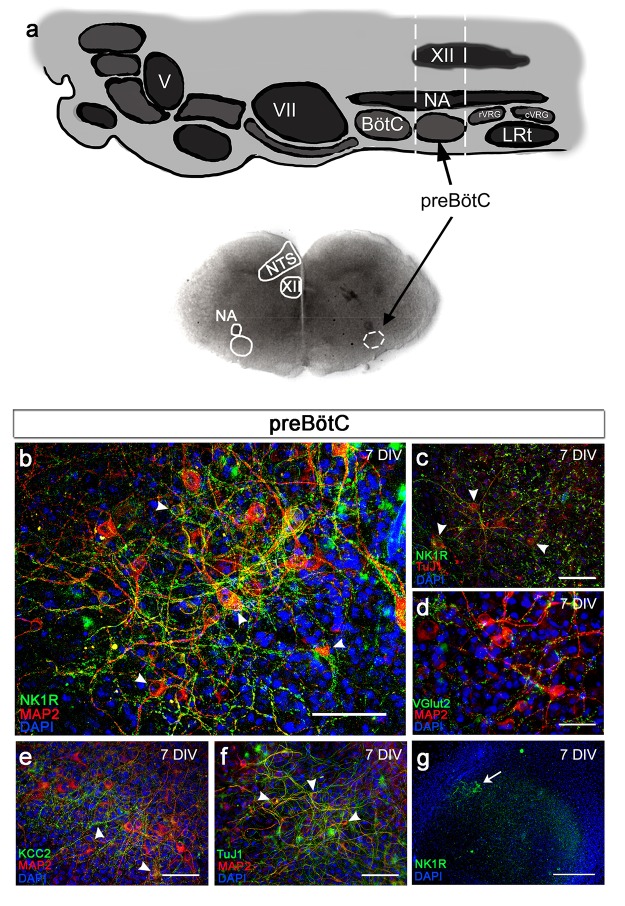
Figure 2. Brainstem slice cultures have a preserved structure and neurons with functional potential.

Brainstem slices containing the preBötC were used to create slice cultures. Anatomical landmarks, including the nucleus ambiguus (NA), nucleus tractus solitarius (NTS), and nucleus hypoglossus (XII; a), as well as the distinct expression of NK1R (b, c, g) enabled the identification of the preBötC region. The brainstem slice displayed MAP2-/Tuj1-positive neurons expressing NK1R (bc), VGlut2 (d), and/or KCC2 (e). The abundant MAP2-/Tuj1-positive cells demonstrated a preserved neuronal network within the preBötC (g). KCC2 expression was found in the NTS, NA, and preBötC (e). DIV; days in vitro. Arrowheads: double-labeled cells. Scale bars: 100 µm in b–f, 500 µm in g.

DOI: http://dx.doi.org/10.7554/eLife.14170.007

Figure 2.

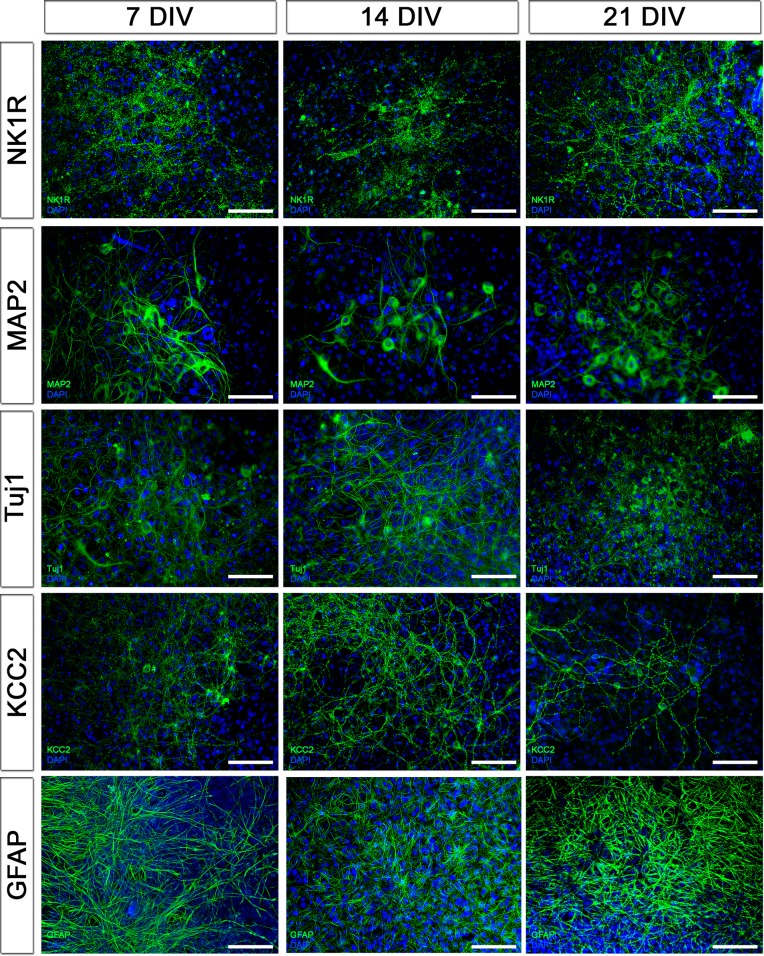
Figure 2—figure supplement 1. Protein expression pattern is preserved during cultivation.

Figure 2—figure supplement 1.

The expression pattern of neuronal the markers NK1R, MAP2, Tuj1 and KCC2 and the astrocyte marker GFAP did not change during cultivation for 3 weeks. DIV: days in vitro. Scale bars: 100 µm.
Figure 2—figure supplement 2. Slices flatten during cultivation.

Figure 2—figure supplement 2.

The gross morphology of the slices changed slightly during cultivation due to thinning and spreading. DIV: days in vitro. Scale bar: 500 µm.
Figure 2—figure supplement 3. Brainstem slice cultures are viable.

Figure 2—figure supplement 3.

An individual single necrotic cells (8 ± 3%, n=257, propidium iodide-stained) were found in the brainstem slice cultures (N=12) that had been cultivated for 3 weeks, but no large clusters of necrotic cells were detected (a, d). The few necrotic cells were observed in the thickest regions, indicating that diffusion-based oxygenation is critically dependent on slice thickness. Oxygen glucose deprivation (OGD) for 1 hr produced clear positive PI-staining throughout the slice (b; N=5). Cultures also showed low apoptotic activity (2 ± 1%, n=187), as evaluated by caspase-3 staining (c, d; N=20). DIV: days in vitro. N: slices, n: cells. Scale bars: 100 µm.