FIGURE 3.

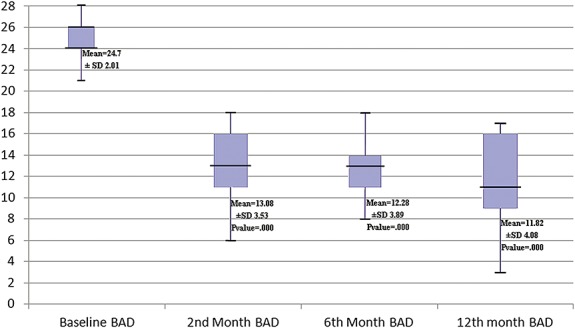
Demonstrating changes in the mean Barry-Albright Dystonia Scale (BAD) during the follow-up period. Color version available online only.

Demonstrating changes in the mean Barry-Albright Dystonia Scale (BAD) during the follow-up period. Color version available online only.