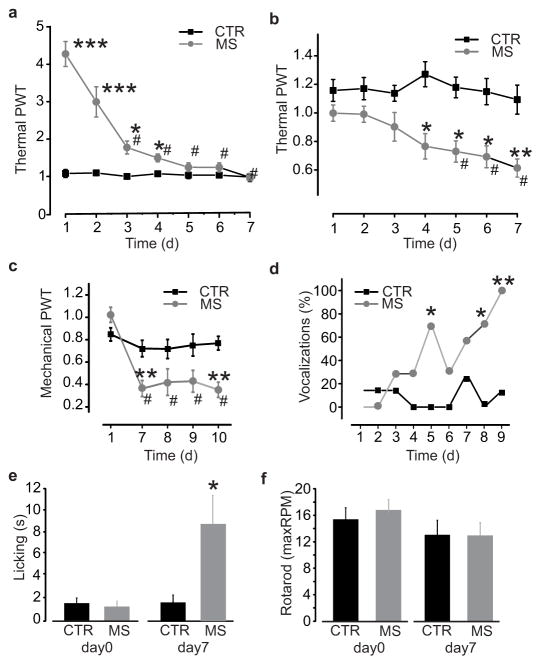
Figure 1. Repeated morphine administration causes hyperalgesia and tolerance.
a–c. Time course of morphine tolerance and pain hypersensitivity assessed by Hargreaves plantar test and von Frey filament in rats: a. Thermal pain threshold 1h after morphine (days 3–7 vs day 1, χ2: 61.5; #P < 0.001) or saline injection (morphine vs saline at days 1–4, *P < 0.05; ***P < 0.001); b. Thermal pain threshold before morphine (days 5–7 vs day 1, χ2: 20.7; #P < 0.001) and saline injection (morphine vs saline at days 4–7, *P < 0.05; **P < 0.01); c. Mechanical pain threshold before morphine or saline injection. At day 7, threshold of morphine treated rats (n = 7) is significantly reduced as compared to day 1 (χ2: 13.58, #P < 0.01) and to the saline group (n = 6; **P < 0.01). d–e. Progressive increase in nociceptive behaviours in morphine-treated rats as compared to saline-treated controls: d. Percentage of vocalizing rats during subcutaneous injections (day 5–9 vs day 1, *P < 0.05; **P < 0.01); e. Licking time after thermal stimulation (day 0, P > 0.05; day 7, U: 7, *P < 0.05). f. Maximal running speed at day 0 and day 7 of saline or morphine injections assessed by rotarod before the morning injection (U: 21, P > 0.05). All threshold values are normalized to the baseline. Abb.: PWT = paw withdrawal threshold; CTR = saline control; MS = morphine sulphate; RPM = revolutions per minute; error bars = s.e.m.

