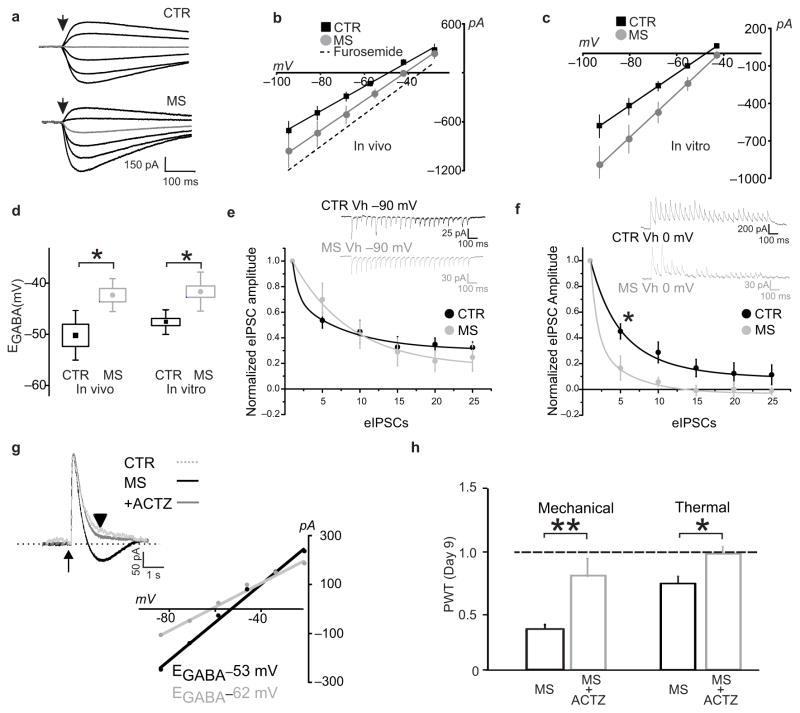
Figure 2. Morphine disrupts Cl− homeostasis in LI neurons.
a–b. Decrease in Cl− extrusion capacity in LI neurons after in vivo morphine treatments in rats: a. Responses to GABA 30 ms puffs following saline- or morphine-treatments in presence of a Cl− load (29 mM). In grey, the response obtained at −55.5 mV. b. I-V relationships for GABAA currents obtained from morphine-treated rats (n = 6 cells) is right-shifted as compared to controls (n = 5 cells); dashed line indicates the I–V relationship when Cl− extrusion capacity is blocked by the KCC2 antagonist furosemide. c. Effect of in vitro morphine (1 μM, > 3 h; n = 7 cells) on I–V relationships for GABAA currents vs saline control (n = 6 cells). d. Pooled EGABA of neurons shown in b (U: 2) and c (U: 6, *P < 0.05). e–f. Cl− accumulation under repetitive inhibitory input. e. Representative traces (average of 10 repetitions) from a control- black- and an in vitro morphine-treated LI neuron- grey- clamped at −90 mV (upper panel); in the graph (lower panel), the rate of eIPSC amplitude depression during repetitive stimulation (20 Hz). Amplitude values are normalized to the first eISPC. No differences were observed (CTR: n = 6; MS: n = 4 cells; F: 0.8, P > 0.05). f. Experiment in e repeated at 0 mV. Note the larger and faster eIPSC depression in morphine-treated neurons. Differences between morphine and controls are significant (CTR: n = 6; MS: n = 4 cells; F: 21.98, *P < 0.05). g. Gramicidin-perforated patch clamp recording of GABA responses obtained at −60 mV in control –red dotted line- and from a morphine treated LI neuron before (in black) and after ACTZ (50 μM; in grey; traces are scaled to the peak amplitude; arrow indicates the GABA puff). Note the biphasic response in the morphine neuron and the monophasic response following ACTZ. Below, I-V curves measured 1 s after the pulse (black arrowhead). Note the increased EGABA difference before and after acetazolamide. h. Effect of intrathecal ACTZ (22.5 μg, from day 7 to 9) on morphine-induced mechanical (saline, n = 5; ACTZ, n = 5; U: 0, **P < 0.01) and thermal (saline, n = 11; ACTZ, n = 9; U: 15.5, *P < 0.05) pain hypersensitivity in rats. All threshold values are normalized to the baseline. dashed line is the baseline threshold. Abb.: PWT = paw withdrawal threshold; CTR = control; MS = morphine sulphate; ACTZ = acetazolamide; error bars = s.e.m.

