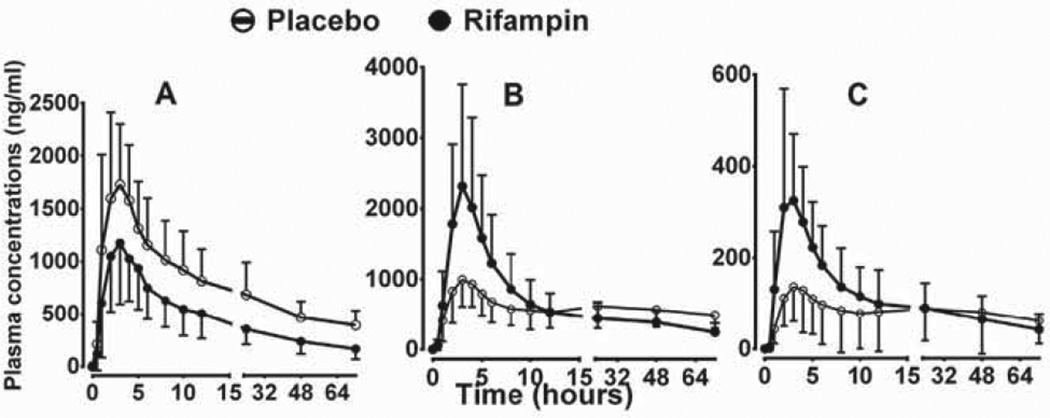
Fig. 1.
Plasma concentration–time profiles of efavirenz (EFV) and its metabolites after the administration of a single 600 mg single oral dose of EFV to healthy volunteers (n = 20) pretreatcd with placebo or 600 mg rifampin once daily for 10 days. (A) EFV; (B)) 8-hydioxyEFV (8-OHEFV); and (C) 8,14-dihydroxyEFV (8,14-diOHEFV). Each point represents mean ± SD.

