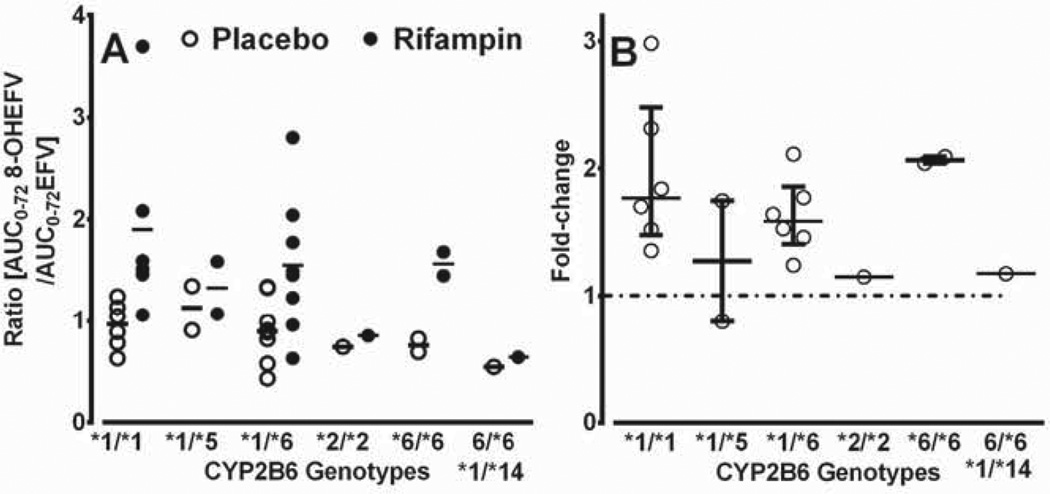
Fig. 5.
Plasma ratios of area under the concentration–time curve (AUC0–72h) of 8-hydmxyefavirenz to AUC0–72h of efavirenz (EFV) according to specific CYP2B6 genotypes in healthy volunteers administered a single 600 mg single oral dose of EPV after pretreatment with placebo or 600 mg rifampin) once daily for 10 days. A) plasma metabolic ratios after placebo (open circles) and rifampin treatment (closed circles); horizontal line represents median value; and B) fold induction (rifampin/placebo), with median and interquartile range. One subject who carried *6/*6 genotype was also heterozygous for a valiant (419G > A; R140Q) tagging *14 and presented individually.

