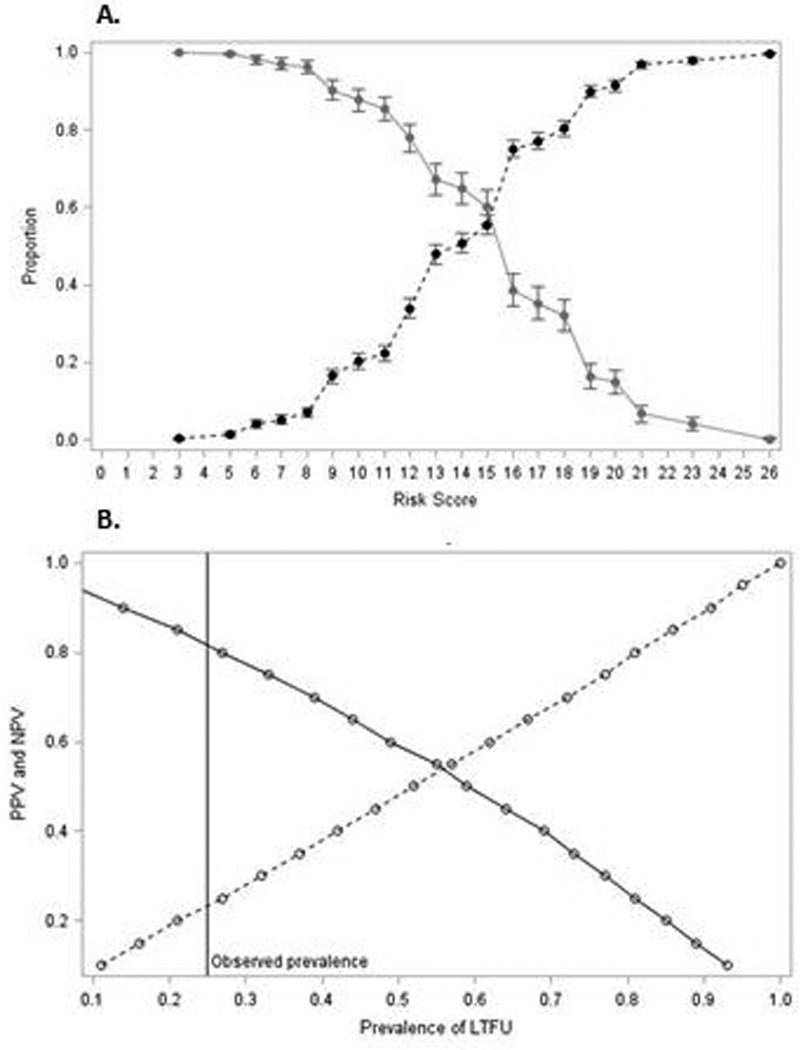
Figure 3.

A. Sensitivity (solid line) and specificity (dotted line) at each risk score cut-off (range 3–26) to predict LTFU at 6-months postpartum among 2,029 HIV-infected Zambian women who initiated cART during pregnancy. B. Positive predictive value (PPV; dashed line) and negative predictive value (NPV; solid line) for risk score cut-point 11, as the prevalence of LTFU varies.
