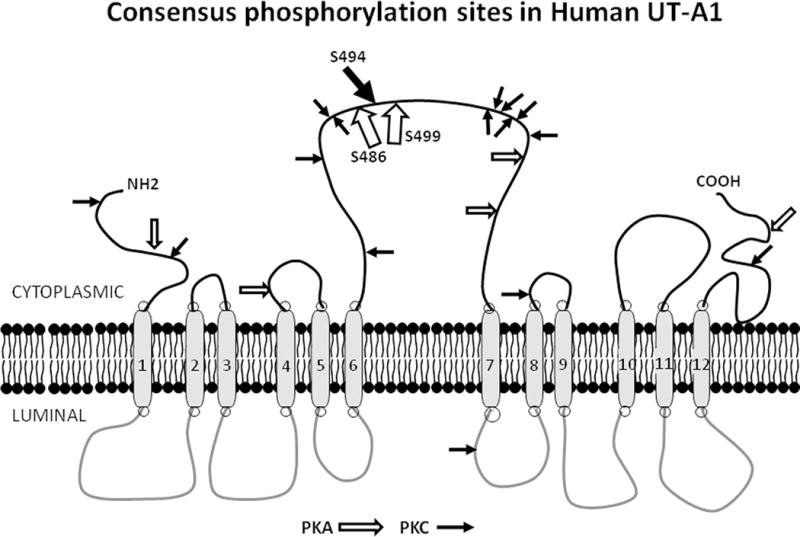
Figure 2.

PKA and PKC consensus phosphorylation sites in UT-A1. This diagram presents UT-A1 in its theoretical 12 membrane spanning domain structure. Consensus phosphorylation sites for PKA are designated with open arrows; those for PKC are designated with closed arrows. The proven PKA (S486, S499) and PKC (Ser 494) sites are located in the large intracellular loop and designated by larger arrows.
