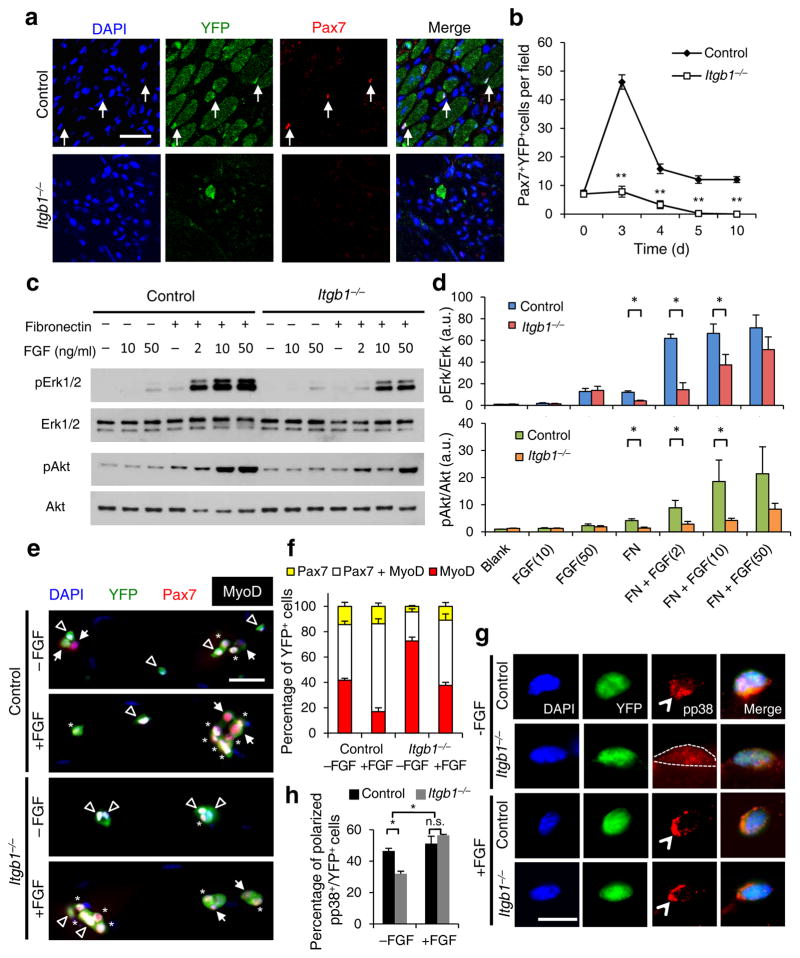
Figure 3.
Itgb1−/− SCs show a compromised response to FGF-2 that can be partially restored by exogenous FGF-2. (a) Control and Itgb1−/− sections 10 d after injury stained for Pax7 and YFP; arrows, Pax7+ SCs; Scale bar, 25 μm. (b) Average number of Pax7+YFP+ cells per field (0.228 μm2) during regeneration; n = 3 animals per time point, ten sections per animal; data are expressed as mean ± s.d.; Student’s t-test: *P < 0.05; **P < 0.01. (c) Western blots for pErk1 and pErk2, Erk1 and Erk2, pAkt, and Akt of control and Itgb1−/− cells. Fibronectin addition (+) and FGF-2 concentrations (FGF(ng/ml)) are indicated. (d) Fold induction from data in c, normalized to control cells without fibronectin and FGF-2 (set at 1 arbitrary unit (a.u.)); n = 4 parallel sets of myoblasts. Paired comparisons with significant differences are indicated; data are expressed as mean ± s.e.m.; two-way ANOVA: *P < 0.05. (e) Control and Itgb1−/− SCs cultured for 96 h with or without 10 ng/ml FGF-2 were stained for YFP, Pax7, MyoD, and DAPI; arrows, Pax7+ cells, asterisks, Pax7+MyoD+ cells, and triangles, MyoD+ cells; scale bar = 25 μm. (f) Percentage distribution of various cell populations from data in (e); n = 3 animals; ≥ 20 myofibers per condition; two-way ANOVA: P < 0.01 for Pax7+MyoD+ and MyoD+, −FGF vs. +FGF (control and Itgb1−/−), control vs. Itgb1−/− (−FGF and +FGF); P < 0.05 for Pax7+, control vs. Itgb1−/− (−FGF). (g) Representative images (n = 25) of YFP+ SCs cultured for 36 h with or without FGF-2 were stained for pp38; polarized, open arrowheads; non-polarized, dashed outline; Scale bar, 10 μm. (h) Percentages of YFP+ SCs with polarized pp38+ from data in g; numerical data are expressed as mean ± s.d.; n = 3 experiments, ≥ 25 myofibers per condition. Data were compared by two-way ANOVA: *P < 0.05 and n.s., not significant.

