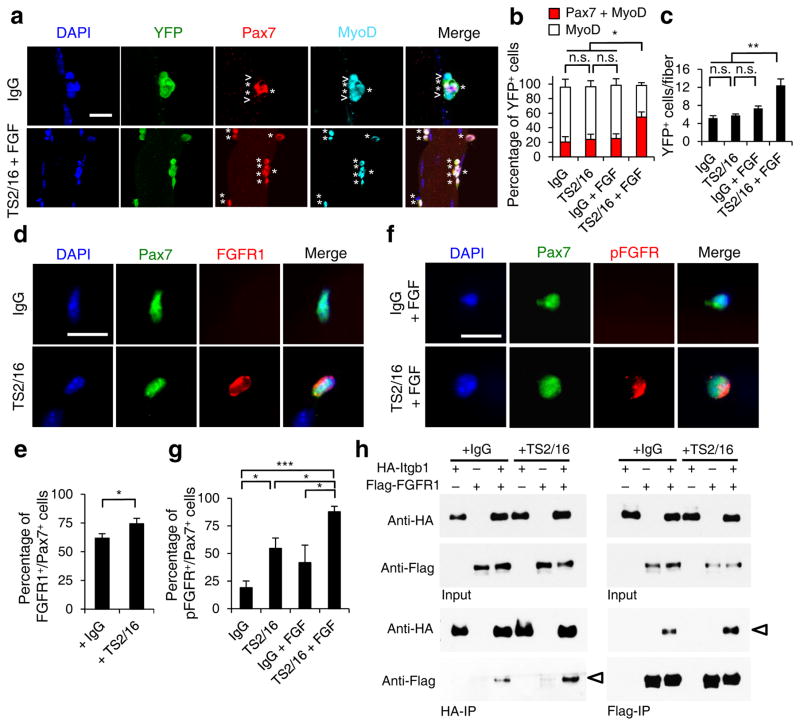
Figure 5.
Activating β1-integrin in aged SCs enhances FGF signaling to promote SC expansion. (a–c) Myofiber-associated YFP+ aged SCs were cultured with IgG or TS2/16 (at 10 μg/ml) and with or without FGF-2 (FGF, 10 ng/ml) for 72 h, and stained for Pax7 and MyoD. (a) Images for IgG alone and TS2/16 + FGF-2 treated cultures; asterisk, Pax7+MyoD+ cells; open arrowhead, MyoD+ cells; Scale bar, 25 μm. (b) Percentages of Pax7+MyoD+ versus MyoD+ cells in all four groups; mean ± s.d.; n = 3 experiments, ≥ 30 myofibers each; two-way ANOVA: *P < 0.05 for TS2/16 + FGF-2 versus others, and not significant (n.s.) between the other groups. (c) Average number of YFP+ cells per myofiber of the same samples in a; mean ± s.d.; n = 3 animals, ≥ 15 myofibers each two-way ANOVA: **P < 0.01 for TS2/16 + FGF-2 versus others, and n.s. between the other groups. (d,e) Myofiber-associated aged SCs cultured for 24 h with IgG or TS2/16 and stained for Pax7 and FGFR1. (d) Representative images (n = 20); Scale bar, 10 μm. (e) Percentage of FGFR1+ cells within the Pax7+ population; mean ± s.d., n = 3 experiments, ≥ 20 myofibers per condition; Student’s t-test: *P < 0.05. (f,g) Aged SCs cultured with IgG or TS2/16, and with or without FGF-2, were stained for phospho-FGFR (pFGFR) and Pax7. (f) Representative images of IgG + FGF-2 and TS2/16 + FGF-2 (n = 20 images of each group); Scale bar, 10 μm. (g) Percentage of pFGFR+ cells within the Pax7+ SC population; mean ± s.d.; n = 3 experiments, ≥ 20 myofibers scored per condition; Student’s t-test: *P < 0.05, ***P < 0.001. (h) Reciprocal co-immunoprecipitation (co-IP) between HA-tagged Itgb1 and Flag-tagged FGFR1 in HEK293T cells, with IgG or TS2/16 added, followed by Western blot; input lysates, top two rows; IPed fractions, bottom two rows; antibodies for IP, labeled at bottom, and for Western blots, left. Open arrowheads indicate co-IPed Flag-FGFR1 (left) and HA-Itgb1 (right).

