
Figure 3. TDP-43 mitochondrial import depends on TOM-TIM23 complex and internal M1, M3 and M5 motifs.
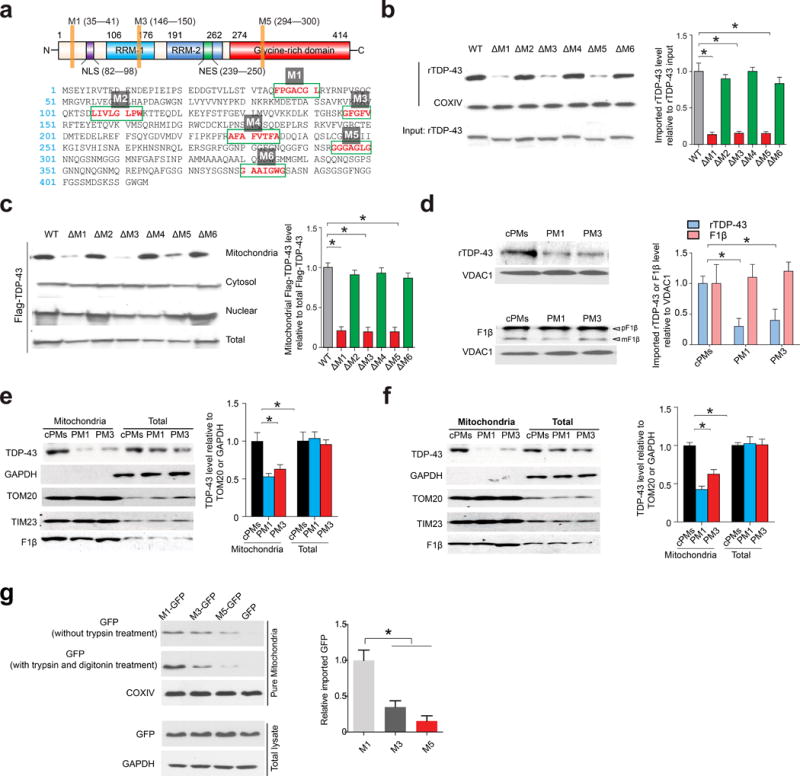
(a) The structure (top panel) and the amino acid sequence (bottom panel) of human TDP-43. RRM1 and RRM2 are RNA recognition motifs. NLS: nuclear localization sequence; NES: nuclear export sequence. (b) Representative immunoblot and quantification (n = 3) of rTDP-43 in mouse brain mitochondria after incubation with indicated rTDP-43 deletions of putative internal targeting signals (ΔM1–6) followed by trypsin and digitonin co-treatment. (c) Representative immunoblot and quantification (n = 3) of TDP-43 in mitochondria from HEK293 cells overexpressing Flag tagged TDP-43 (ΔM1–6) using anti-Flag antibody. (d) Representative immunoblot and quantification (n = 3) of Flag tagged rTDP-43 and pF1β in mitochondria that were pre- or co-treated with 5 μM control peptide (cPM), PM1 or PM3, followed by mitochondrial import assay using rTDP-43 or pF1β incubation. (e,f) Representative immunoblot and quantification (n = 3) of TDP-43 in mitochondria from HEK293 cells (e) or rat primary cortical neurons (12 days in vitro: DIV 12, f) treated with 1 μM cPM, PM1 or PM3 for 24 hours. (g) Representative immunoblot and quantification (n = 3) of GFP in isolated mitochondria from HEK293 cells expressing GFP or M1, M3 and M5-GFP (N-terminus tag). HEK293 cells were collected two days after transient transfection. Quantification is based on samples co-treated with trypsin and digitonin. Data are means ± s.e.m of triplicate experiments. Statistics: one-way analysis of variance (ANOVA) followed by Tukey’s multiple comparison test. *P < 0.05.