
Figure 5. TDP-43 specifically reduces complex I assembly and impairs mitochondrial function and morphology.
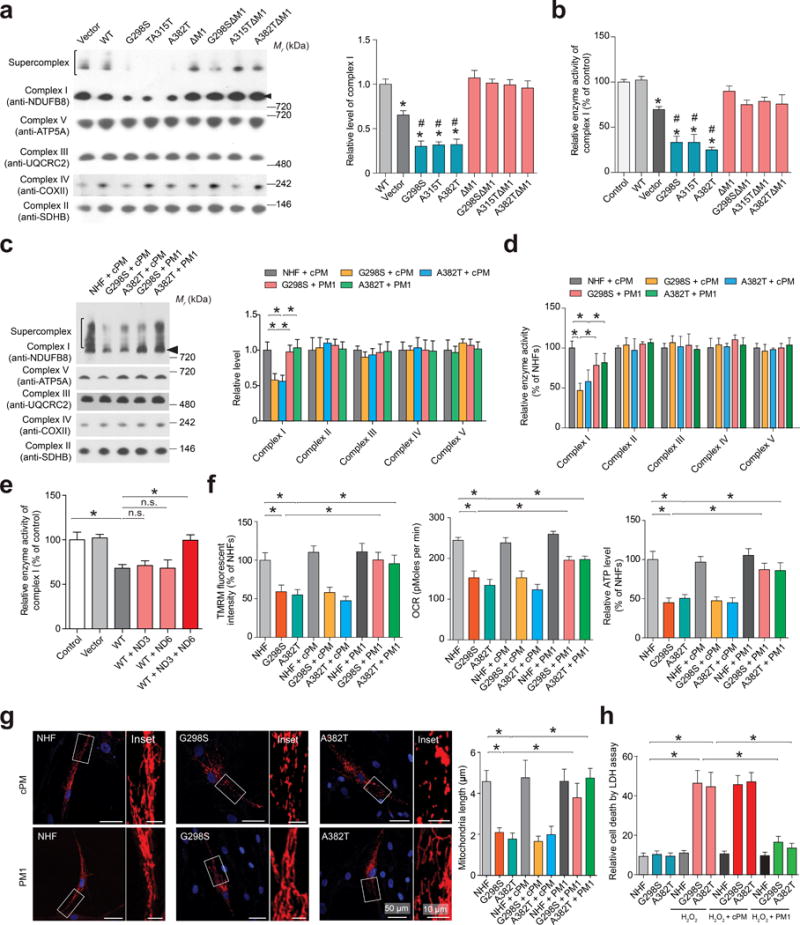
Representative images and quantification (n = 3) of complex I or I–V assembly (a,c) and activities (b,d) in HEK293 cells overexpressing Flag tagged TDP-43 (a,b), and human fibroblasts 48 hours after 1 μM cPM (scrambled M1) or PM1 treatment (c, d). Arrowheads point to complex I. (e) Measurements (n = 3) of OXPHOS complex I activity in mitochondria from HEK293 cells overexpressing Flag tagged WT TDP-43, ND3 and ND6. (f) Measurements (n = 3, normalized by total protein) of mΔψ (by TMRM), ATP production and OCR in human fibroblasts 48 hours after 1μM cPM (scrambled M1) or PM1 treatment. (g) Representative confocal images and quantification (n = 3) of mitochondrial length in human fibroblasts. Fibroblasts were transfected with mitoDsRed2 (a mitochondrial specifically localized red fluorescent protein) to label mitochondria. Nuclei were stained by DAPI. n = 50 cells per group. (f) Measurement (n = 3) of the sensitivity of human fibroblasts to H2O2. Fibroblasts were pre-treated with 1 μM cPM or PM1. 48 hours after pre-treatment, fibroblasts were treated with 50 μM H2O2 for 1 hour and LDH assay performed after 3 hours of recovery. Data are means ± s.e.m of triplicate experiments. Statistics: one-way analysis of variance (ANOVA) followed by Tukey’s multiple comparison test. *P < 0.05. In panel a and b, *P < 0.05, compared with control cells and #P < 0.05, compared with cells expressing WT TDP-43.