
Figure 2.
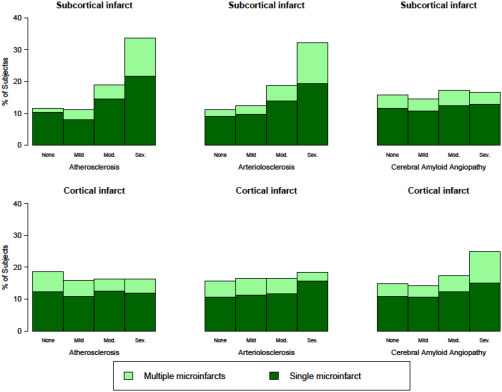
Distribution of cerebral vessel pathology by cortical and subcortical microinfarcts. Legend: Each panel shows % of subjects by level of vessel pathology severity (left most column: atherosclerosis, middle column: arteriolosclerosis, right most column: amyloid angiopathy) and burden of cortical (bottom row) or subcortical microinfarcts (top row). Light green represents multiple microinfarcts in the given location, and dark green represents a single microinfarct, and white represents no microinfarcts. Note the shift toward an increased burden of subcortical microinfarcts with increased atherosclerosis and arteriolosclerosis severity (top left and top middle panels), and shift toward an increased burden of cortical microinfarcts with increased amyloid angiopathy severity (bottom right panel).