Fig. 4.

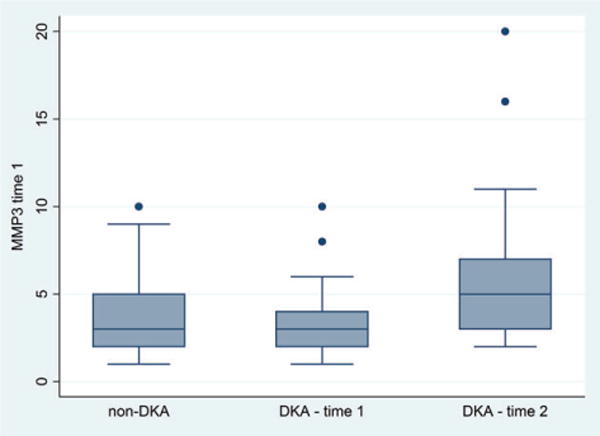
Plasma matrix metalloproteinase (MMP)-3 levels are presented for diabetes controls (n = 23), children with diabetic ketoacidosis (DKA) at presentation (time 1) (n = 34), and children with DKA during therapy (time 2) (n = 26). Box plots show the interquartile range (IQR) (shaded box), median (box center line) with fences extending to 1.5 times the IQR. Circulating MMP-3 levels were similar in children with DKA compared with diabetes controls at time 1 (mean 5 vs. 4 ng/mL, p = 0.81), but were significantly higher at time 2 (mean 8 vs. 4 ng/mL, p = 0.013).
