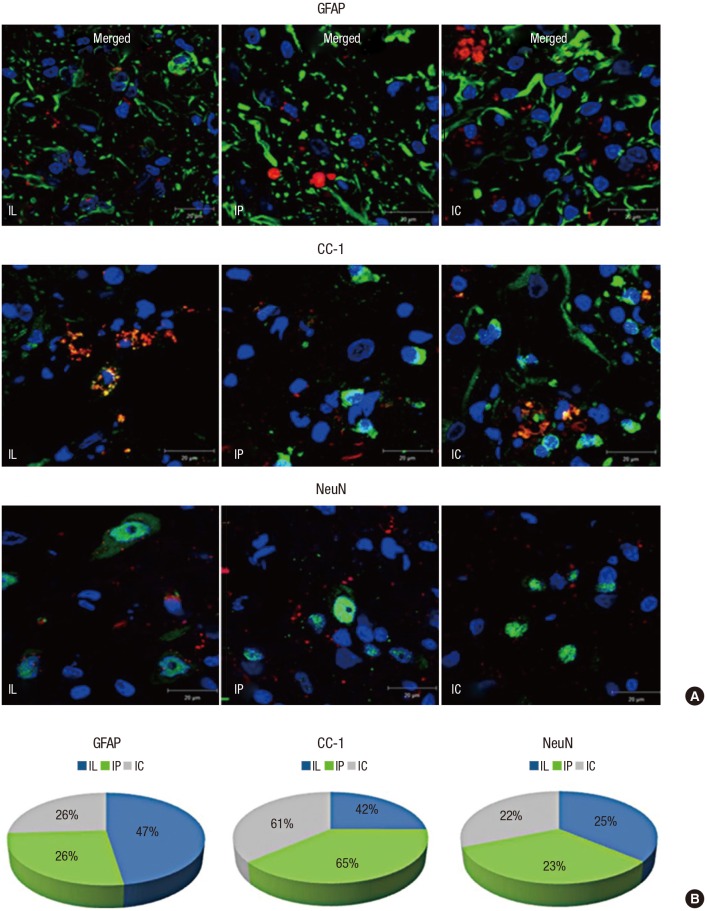
Fig. 4.
MSCs showed various differentiated cell types according to their transplantation delivery routes. (A) Co-localized IF staining with PKH 26 (red), DAPI (blue), and cell markers (green) for differentiated cells were counted under high-power magnification (× 1,000); cell markers were GFAP for astrocytes, CC-1 for oligodendrocytes, and NeuN for neurons. (B) Astrocytic differentiation was predominant in the IL group; Oligodendrocytic differentiation was predominant in the scaffold groups; Neuronal differentiation in each group showed similar proportions.

