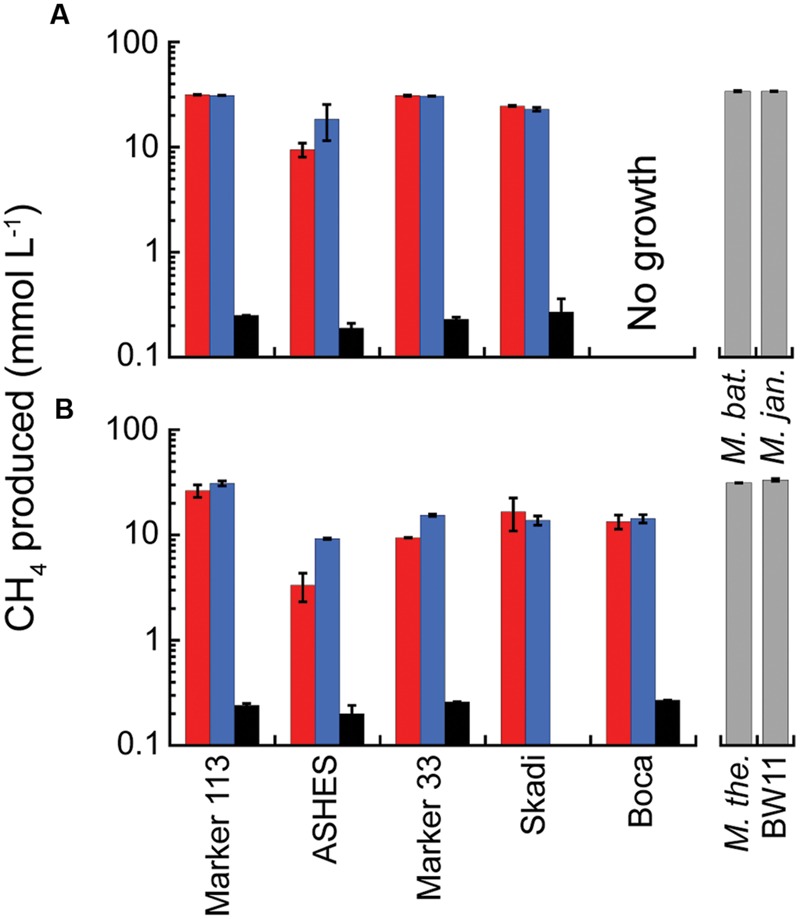
FIGURE 2.

Average total CH4 production in 2013 microcosms. The microcosms were incubated at 80°C (A) and 55°C (B) and amended with 200 kPa of H2:CO2 (red); 200 kPa of H2:CO2 plus 47 μM NH4Cl (blue); and 2 kPa of H2 and 198 kPa of N2:CO2 (black). The gray columns show the total CH4 production for the four pure cultures in modified DSM 282 medium for comparison. The sample bars represent the range of the duplicate incubations.
