FIGURE 5.

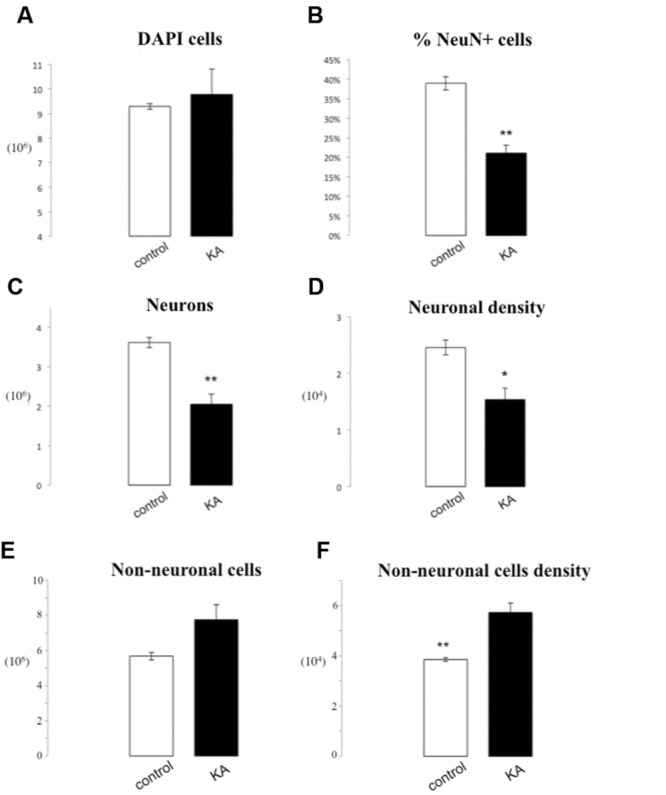
IF quantification after KA administration. Histograms representing the total number of DAPI positive cells (A) in the hippocampus, the percentage of NeuN positive nuclei upon DAPI+ cells (B), the total number of neurons (C), and the neuron density, as cells/mg (D), as well as the total number of non-neuronal cells (E) and non-neuronal cells density (F). Data are presented as mean ± SEM and control vs. ischemic group (T-test, ∗p ≤ 0.5, ∗∗p ≤ 0.01, n = 3).
