
Figure 1.
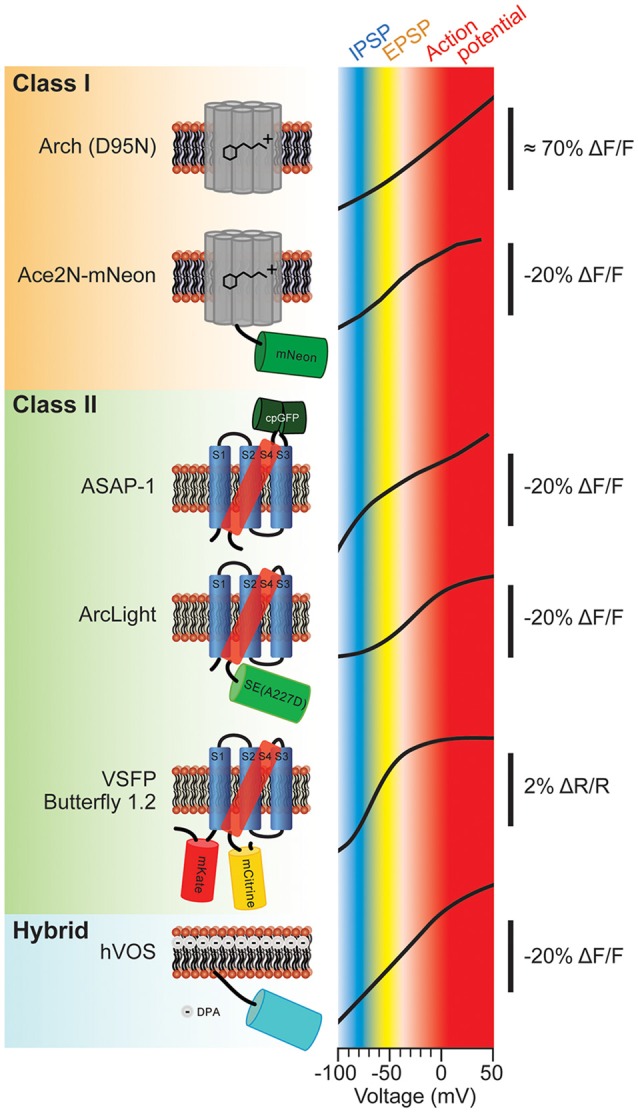
Various types of genetically-encoded voltage indicators (GEVIs) and their voltage sensitivities. The voltage sensitivities of different GEVIs are compared. Typical voltage ranges of inhibitory postsynaptic potential (IPSP), excitatory postsynaptic potential (EPSP) and action potential are indicated as blue, yellow and red, respectively. The vertical scale bar with minus ΔF/F indicates that the fluorescence dims upon depolarization of the plasma membrane. The voltage-sensitivity curves were as reported in: Arch (D95N; modified with permision from Kralj et al., 2012, Figures 3B, 5); Ace2N-mNeon (modified with permission from Gong et al., 2015, Figure 1D); ASAP-1 (modified with permission from St-Pierre et al., 2014, Figure 1D); ArcLight (modified with permission from Jin et al., 2012, Figure 1C); Butterfly 1.2 (modified with permission from Akemann et al., 2012, Figure 2C); hybrid voltage sensor (hVOS; modified with permission from Chanda et al., 2005, Figure 1D).