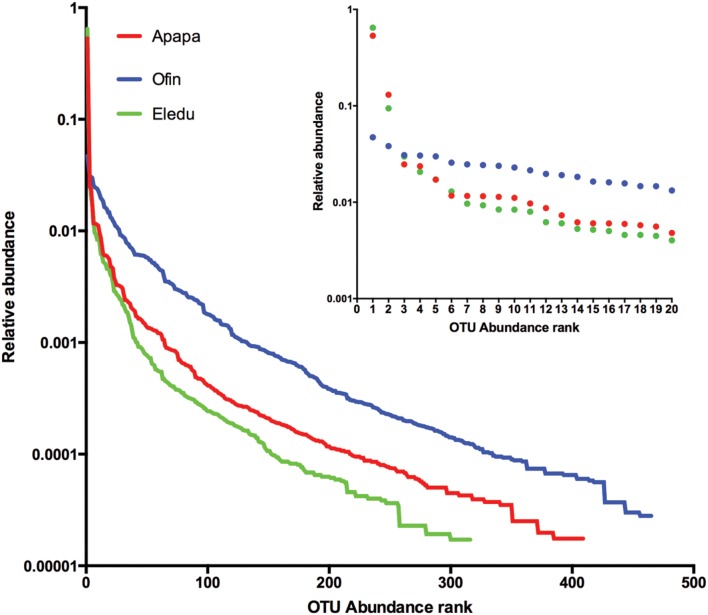
FIGURE 2.
Whitaker plots of average operational taxonomic unit (OTU) abundance in the sediment communities. For each sediment, OTU are plotted from most abundant (rank 1) to least. The large plot shows the entire data set for each sediment, while the inset shows a detailed view of the top 20 most abundant OTU in each sediment.

