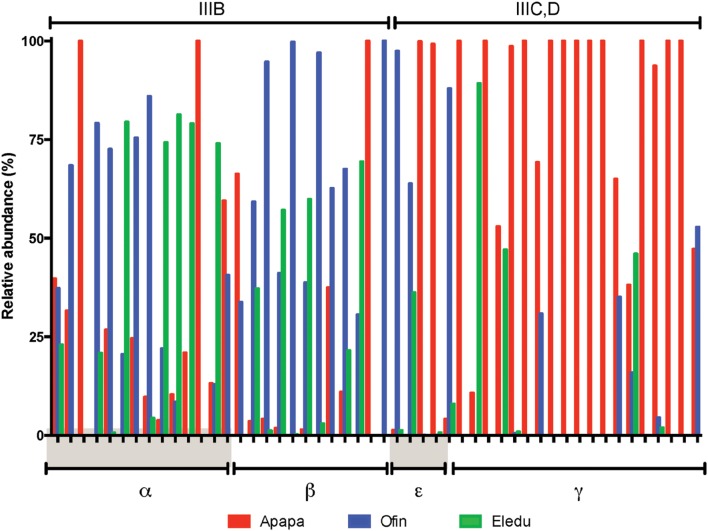
FIGURE 9.
Expanded view of proteobacterial OTU showing significant correlations in abundance to PAH/metals of subcluster III (see Figures 7 and 8A,B). Bars show the relative abundance of each OTU in the indicated sediment, expressed as percentage of the total abundance of the OTU across all samples. Proteobacterial subclasses illustrated are α, alpha; β, beta; γ, gamma, and ε, epsilon. Abundance of each OTU in each sediment is in each of the sediments indicated by bar color (Apapa, red; Ofin, blue; Eledu, green) and expressed as a percentage of the total number of quality-filtered amplicons assigned to that OTU across all sediments.

