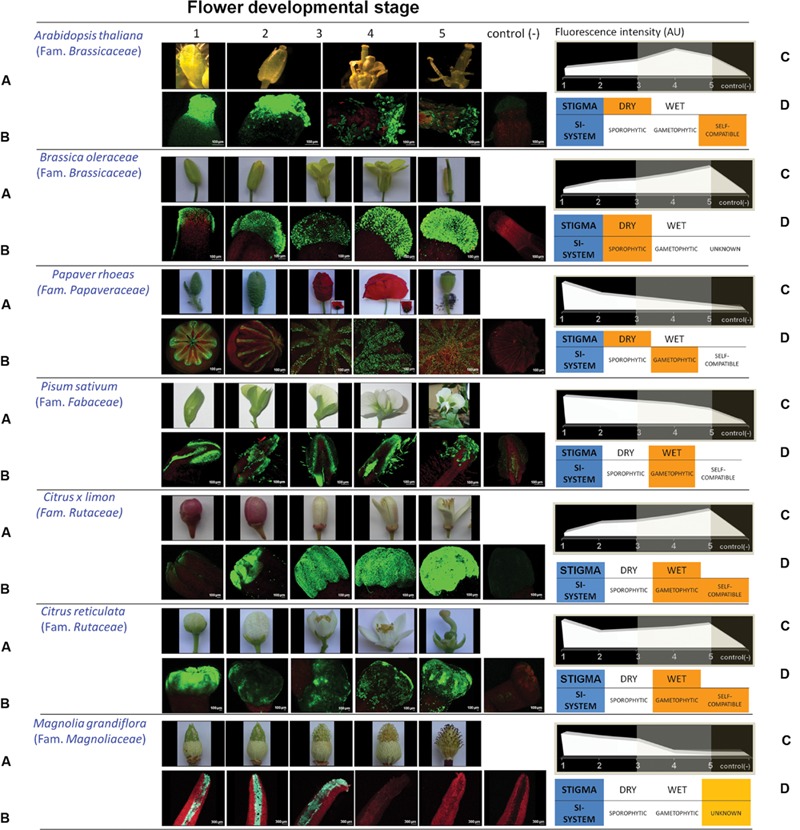
FIGURE 1.

Patterns of reactive oxygen species (ROS) distribution in different Angiosperm species. (A) Pictures showing flower developmental stages from different Angiosperm families. Five different stages were differentiated (four stages in Arabidopsis thaliana, displaying dehiscent anthers before flower bud opening). (B) 3-D reconstructions of the whole stigma surface from multiple optical sections. The presence of ROS is shown as a fluorescent signal (green) exclusively obtained in the range of 515–560 nm emission wavelengths, whereas tissues autofluorescence was recorded in red. Green fluorescence was extensively localized in the exudate (wet stigmas), as well as in stigmatic papillae. Identical settings were used for image capture in both control/test experiments in order to ensure reproducibility. (C) Developmental patterns resulting from fluorescence quantification (AU: arbitrary units). (D) Additional details as regards to type of stigma (dry, wet) and self-incompatibility system for each plant analyzed.
