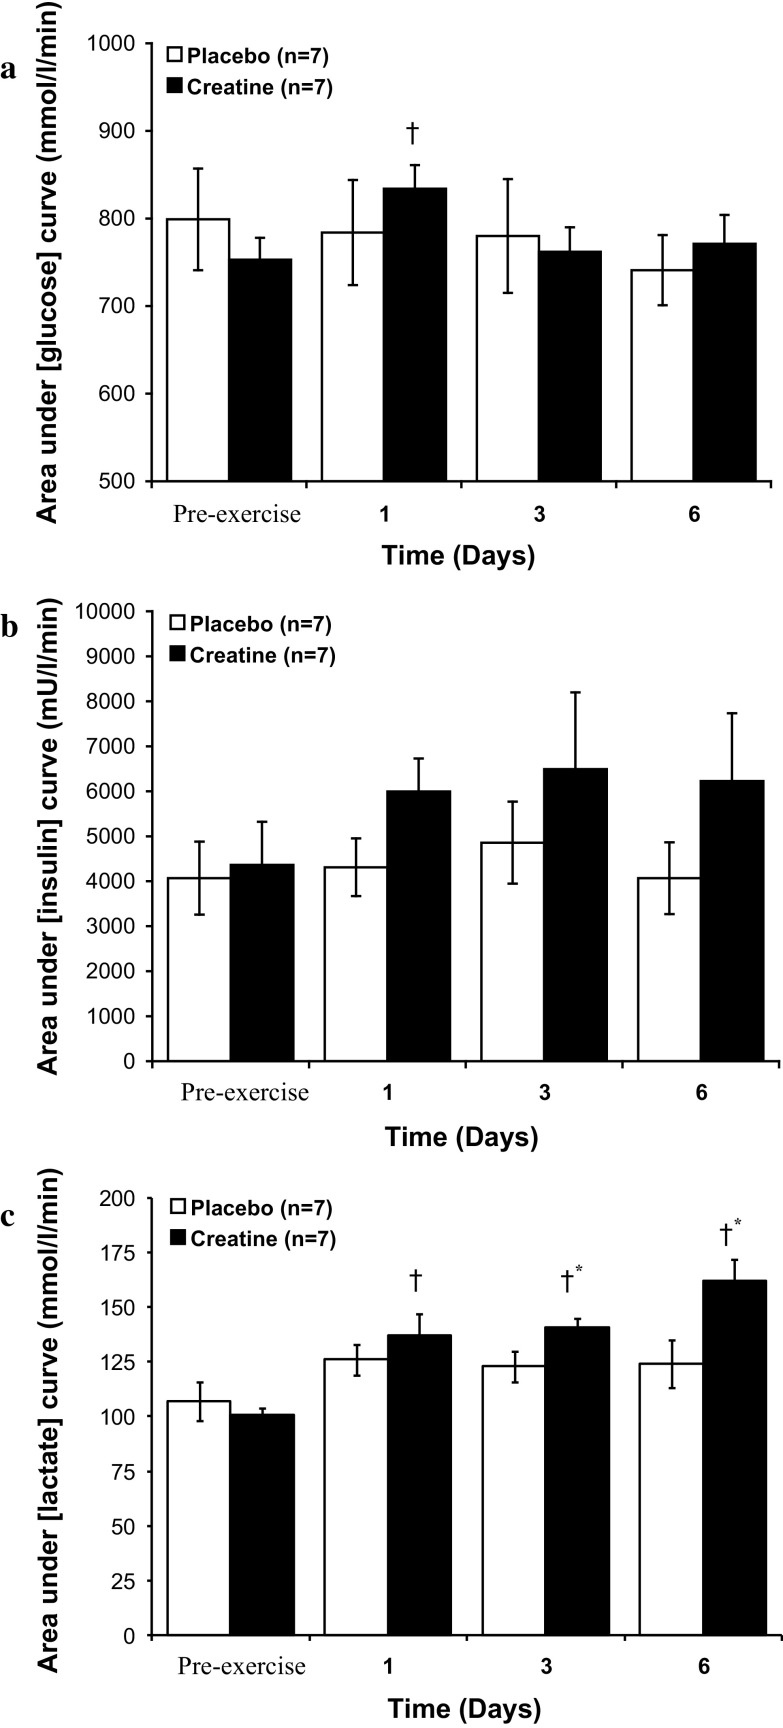
Fig. 4.
Area under the curve during an oral glucose tolerance test (GTT) for blood glucose (a), serum insulin (b) and blood lactate (c) before (pre-exercise) and after 1, 3 and 6 days of Cr + carbohydrate or glycine + carbohydrate supplementation following glycogen-depleting exercise in man. Results are expressed as means ± SEM. Area under plasma glucose and lactate curve expressed as (mmol l−1 min−1), area under serum insulin curve expressed as (mU l−1 min−1). † different from the pre-exercise time point within the same treatment group (P < 0.05); * different from placebo group at the corresponding time point (P < 0.05)

