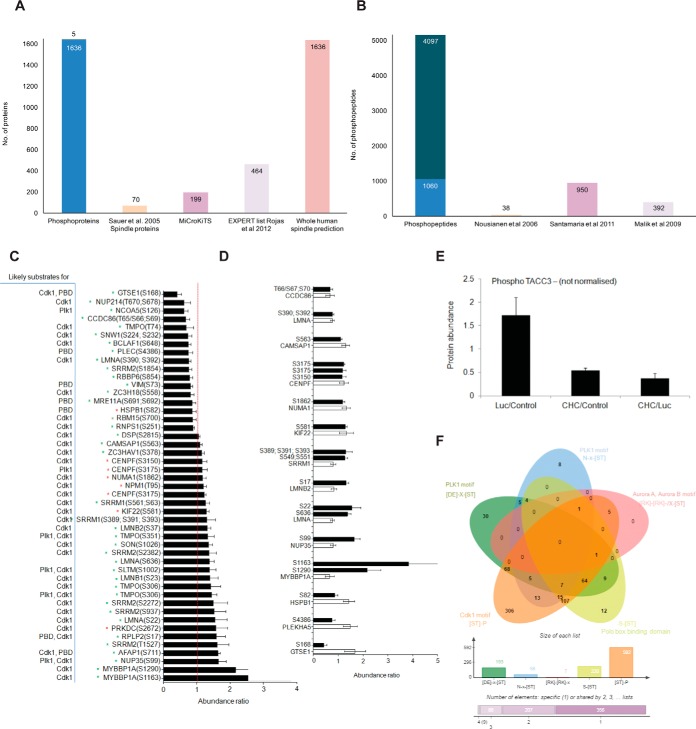
Fig. 3.
Phospho-regulation upon CHC knock-down. A, Bar graph depicting the number of phosphoproteins that overlap between our study (Phosphoproteins) and proteins classified as localizing to the spindle by Sauer et al., 2005 (Sauer spindle list) (3), MiCroKiTS, the Expert list and predicted spindle proteins in the whole human proteome (37). B, Bar graph depicting the number of phosphosites that were identified in our study (Phosphosites) and those that were also identified in studies by (42, 43, 44). C, Bar graph depicting the normalized abundance of significantly altered phosphosites upon CHC knockdown. Data is presented as the ratio of CHC/Luc. Error bars represent S.E. n≥3, p < 0.05 (t test). Red asterisk, known spindle or spindle-associated proteins; Green asterisk, predicted spindle proteins. D, Bar graph depicting the normalized abundance of significantly altered phosphosites (white bars) among significantly altered proteins (black bars) upon CHC knockdown. Data is presented as the ratio of CHC/Luc. Error bars represent S.E. n≥3, p < 0.05 (t test). E, Total phosphoprotein abundance of TACC3 (nonnormalized), as determined by quantitative mass spectrometry. Error bars represent S.E. n≥3. w.r.t value of 1). F, Venn diagram depicting the overlap of consensus motifs for Plk1 (D/E-X-S/T), Aurora A/B kinases (R/K-R/K-X-S/T), Polo box-binding domain (S-S/T) and Cdk1 kinase (S/T-P) within the quantified phosphopeptides (803 normalized phosphopeptides). The size of each list is shown in the bar graph below.

