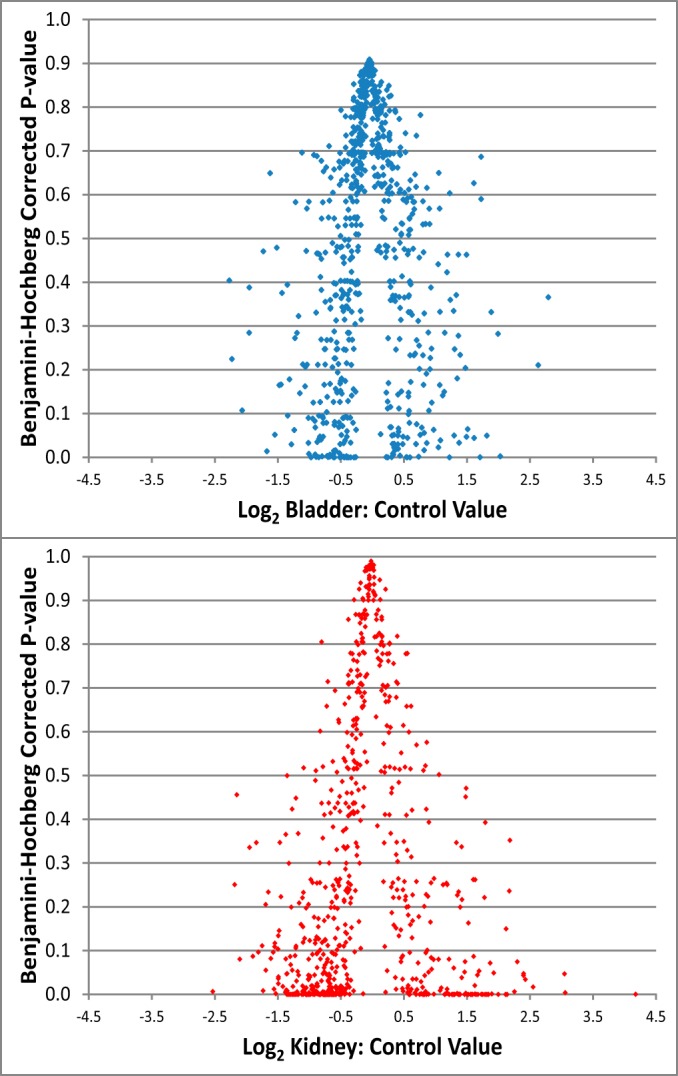
Fig. 2.

Volcano plots of the KC (A) and BC (B) ratios determined for all proteins quantified. The KC ratios were shifted toward smaller Q-values and larger fold changes overall, suggesting that KU samples were more altered than BU samples, as expected. This highlights the value of analyzing urine directly from the obstructed kidney.
