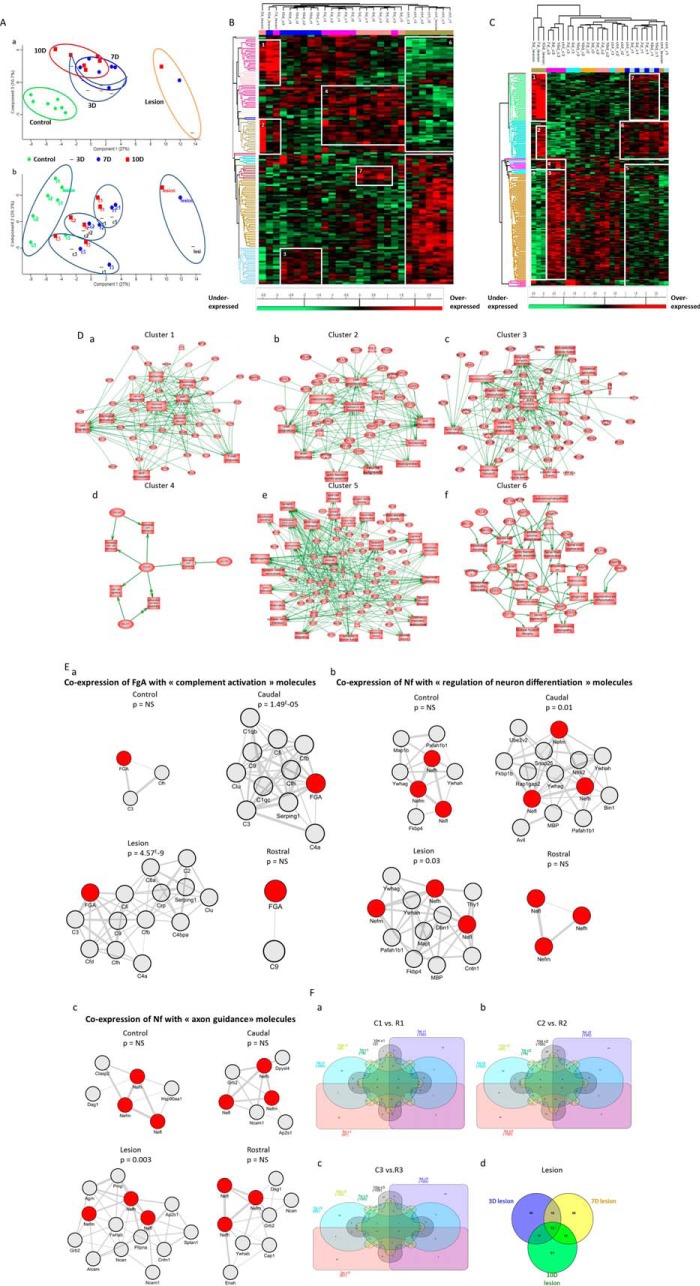
Fig. 2.
Spatio-temporal organization of proteins. A, Principal component analysis (PCA) of conditioned media shows the representation of the different samples grouping regarding (a) time after injury and (b) spatial organization of the spinal cord. One point corresponds to all proteins identified according to their label free quantification for each segments and each time point. Heat map of proteins with different secretion profiles in conditioned media from different time after SCI (3D, 7D, 10D, and control) and from different segments (R3, R2, R1, L, C1, C2, C3). B, Hierarcherical clustering regarding time point. C, Hierarcherical clustering regarding spatial organization. Distinct clusters are highlighted. D, System biology analysis for network identification in each cluster issued from heat map of proteins with different secretion profiles in conditioned media from different time after SCI (3D, 7D, 10D, and control) and from different segment (R3, R2, R1, L, C1, C2, C3) regarding the spatial organization. E, Analysis of coexpression networks identify in inflammation, neuro-axonal and axonal guidance in conditioned media. The 100 genes which encoded molecules were the most tightly coregulated with fibrinogen- α (FgA), neurofilament L, M and H (Nf) respectively in conditioned media control, rostral, lesion and caudal were identified and assessed for gene set enrichment. Panel Ea showns subnetworks of genes annotated by the GO terms “inflammation”, caudal and lesion segments have significant p value unlike control and rostral segments. Panel Eb presents subnetworks of genes annotated by the GO terms “neuro-axonal,” caudal and lesion have significant p value unlike control and rostral segments. Panel Ec shows subnetworks of genes annotated by the GO terms “axonal guidance”, only lesion has significant p value unlike caudal, lesion and rostral segments. F, Differential distribution of unique and common/intersected biological and functional pathways among the three spinal cord rostral and caudal regions (C1, C2, C3 versus R1, R2, and R3) factored by time of SCI (3, 7, and 10 days). Each pair of spinal cord region (C1 versus R1) was analyzed across the three time points represented utilizing a comprehensive Venn analysis representation extracted from Subnetwork Enrichment Analysis.

