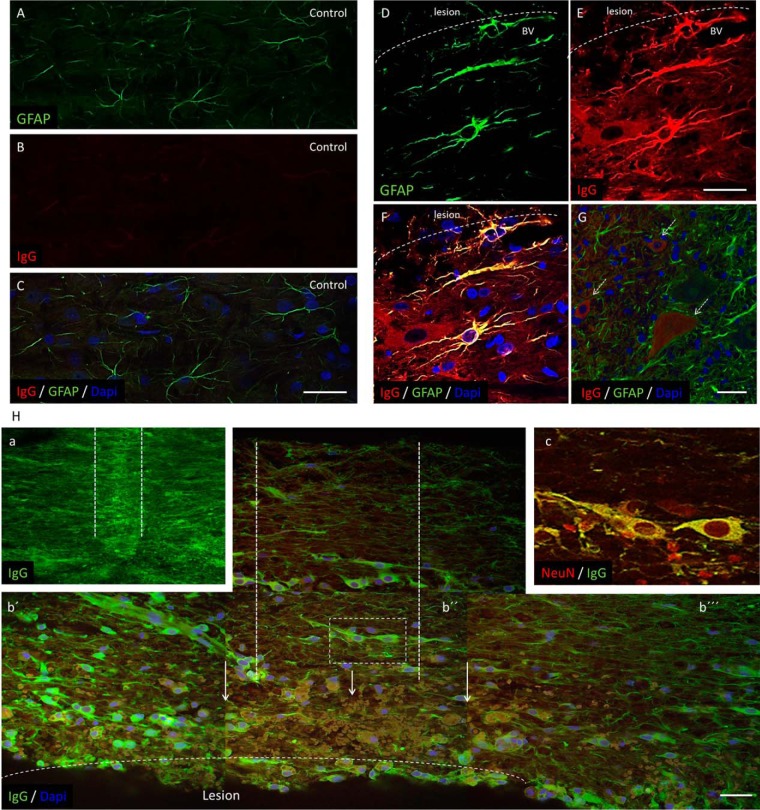
Fig. 9.
Representative images of GFAP-positive astrocytes expressing IgG. Control spinal cord sections contained typical astrocytes with star like thin processes (A), lacking IgG (red) expression (B), confirmed by double labeling (C). In contrast, reactive astrocytes with hypertrophic appearance and thick processes, coexpressed IgG (yellow) at the lesion site were found around neuronal bodies and vessels after 3days (D–F). In neighboring rostral and caudal segments, some neurons expressing IgG (red, arrows), but not GFAP-positive astrocytes (green) were detected (G). Scale bar = 25 μm. H) Intraspinal delivery of anti-CD-20 antibody in rats surviving 3days. (a) Identification of anti-CD-20 delivery tract within the spinal cord tissue labeled with goat-anti rat IgG (green). Note, there is no visible depletion of IgG labeling. (b, b′, b′′, b′′′) composite of four detailed figures showing the region adjacent to the lesion, where delivery of CD-20 was performed (outlined by two bars) and is accompanied with infiltrated erythrocytes (arrows) and neurons expressing IgG. At the injections site as well in rostro- caudal axis neurons and their processes expressing IgG were detected. (c) Detail of boxed area from b′′ shows double labeling of anti-IgG and anti NeuN confirmed neuronal expression of IgGs. Scale bar = 30 μm.

