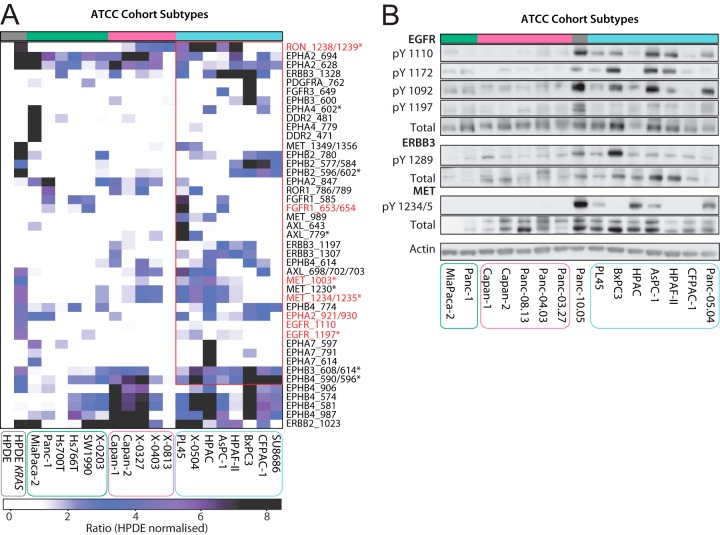
Fig. 4.
Kinase activation as a basis for ATCC subtype 3 characterization. A, LC-MS/MS quantified RTK tyrosine phosphorylation across the ATCC cell lines. Phosphosite intensities are normalized using HPDE cell line site-specific phosphorylation. t test significant sites (p < 0.05) are indicated by an asterisk (*). Activation sites identified are highlighted by red text. B, ATCC cell lines RTK activity was characterized by Western blotting using EGFR, ErbB3 and MET phosphotyrosine specific antibodies. ATCC cell lines are divided into subtype 1 (green), 2 (pink) and 3 (blue). Gray bar: unclassified cell line.

