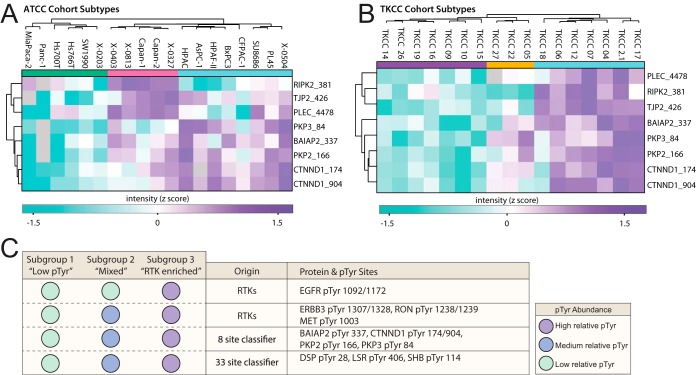
Fig. 6.
A random forest-derived phosphosite signature distinguishes PDAC subtypes. A, Clustering of the eight “common classifier sites” segregates the ATCC cell line cohort into subtypes (See colored bars, subtype 1 is green, 2 is pink and 3 is blue). B, Clustering of the eight “common classifier sites” segregates the TKCC cell line cohort into subtypes (See colored bars, subtype 1 is purple, 2 is orange and 3 is blue). C, A summary table of pTyr sites with consistent abundance profiles for a given subtype across the two PDAC cell line cohorts. These include subtypes; “Low pTyr” (subtype 1 shown by green in ATCC, purple in TKCC), “Mixed pTyr” (subtype 2 shown by pink in ATCC, orange in TKCC) and “RTK enriched” (subtype 3 shown by blue for both ATCC and TKCC).

