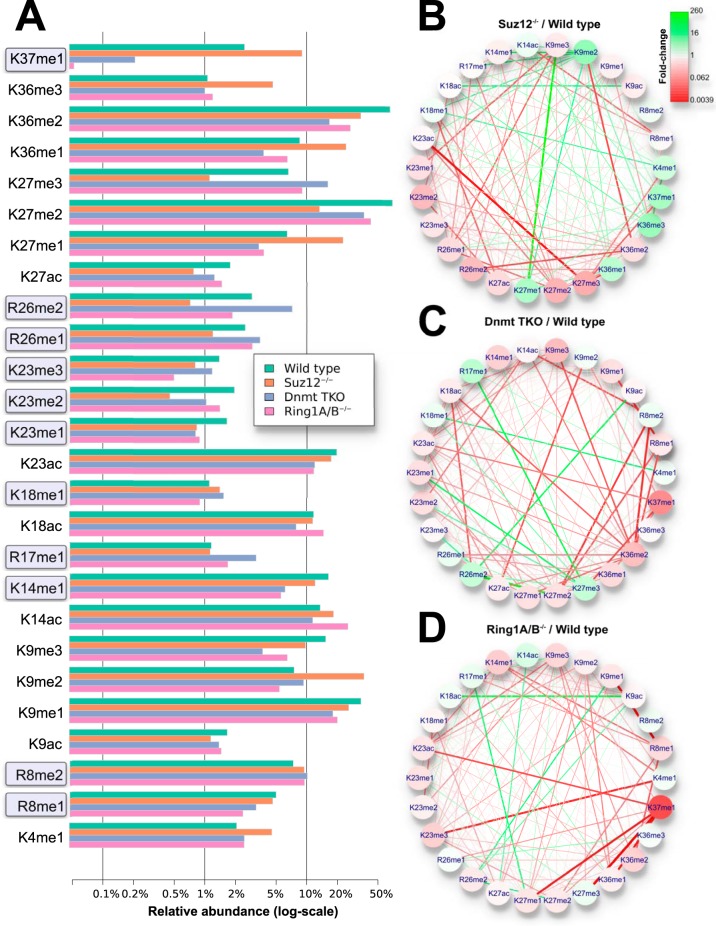
Fig. 2.
Relative abundance of single and binary PTMs in H3 tails from four mESC lines. A, Comparison of frequencies of the most abundant individual marks in wild type cells (logarithmic scale). Commonly found marks include methylation and acetylation of K9, K27, and K36. In addition, less well characterized marks were detected at rather high abundance, including R8me1/2, K14me1, R17me1, K18me1, K23me1/2/3, R26me1/2, and K37me1 (gray boxes). These marks also exhibited abundance changes upon perturbations, except for R8me1/2. B–D, Abundance fold changes for individual marks (nodes) and pairs of marks (edges) for three perturbed ESC systems compared with wild type cells. Only PTM marks with wild type abundance larger than 1% are shown. Green and red colors denote increase or decrease versus wild type, respectively. Suz12 depletion mostly leads to decrease of K27me2 and K27me3 and increase of competing marks such as K9me2. Ring1A/B−/− and Dnmt TKO have strong impact on K37me1.

